Figures & data
Table I. Comparison of the characteristics between the follow-up and total hypertensive groups.
Table II. Characteristics of blood pressure groups at follow-up.
Table III. Levels of target organ damage (TOD) index in different groups of blood pressure changes.
Table IV. Prevalence of target organ damage (TOD) in different groups of blood pressure changes.
Table V. Risk factors for target organ damage.
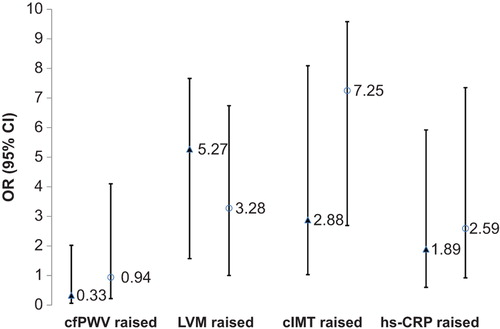
Figure 1. Effects of blood pressure on cardiovascular target organ damage. Normotensive as control; black triangles represent non-sustained hypertension; white circle represent sustained hypertension; black line represents 95% confidence interval (CI). OR, odds ratio; cfPWV, carotid–femoral pulse-wave velocity; LVM, ventricular mass index; cIMT, carotid intima–media thickness; hs-CRP, high-sensitivity C-reactive protein.