Figures & data
Table I. Subject characteristics.
Table II. Exercise test results.
Figure 1. Plot of the 18 nonlinear calibration functions derived from the 18 individual data sets of systolic blood pressure and pulse transit time.
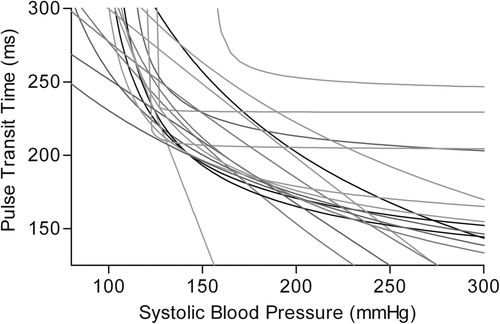
Figure 2. Box plot of pulse transit time (PTT) and corresponding sphygmomanometer systolic blood pressure (SBP), PTT-derived SBP estimate and volume clamp (Portapres) SBP at reference points P1–P11. The line through the box indicates the median, the box represents the interquartile range, and the whiskers represent the full range of values.
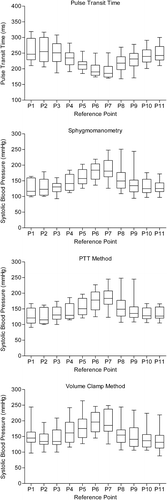
Table III. Bland–Altman comparisons: agreement between sphygmomanometer systolic blood pressure (SBP) values and pulse transit time (PTT)-derived SBP estimates, and between sphygmomanometer SBP values and volume-clamp derived SBP (Portapres).
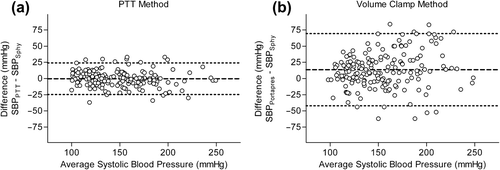
Figure 3. Bland–Altman plots. The outer lines indicate the limits of agreement, the inner line represents the mean difference. (a) Bias (–0.3 ± 12.4 mmHg) and limits of agreement (–24.7 to 24.1 mmHg) between systolic blood pressure measured by arm cuff sphygmomanometer (SBPSphy) and pulse transit time (PTT)-derived systolic blood pressure estimate (SBPPTT). (b) Bias (14.0 ± 28.5 mmHg) and limits of agreement (–42.0 to 70.1 mmHg) between systolic blood pressure measured by arm cuff sphygmomanometer (SBPSphy) and systolic blood pressure measured by volume clamp technique using Portapres Model-2 (SBPPortapres).