
Figures & data
Table 1. Clinical characteristics of the total study population and groups according to their dipping status.
Table 2. Ambulatory blood pressure (BP) measurements of the total study population and groups according to their dipping status.
Table 3. Univariate predictors of non-dipping and elevated night-time blood pressure (BP).
Table 4. Independent covariates of non-dipping blood pressure (BP) pattern in multivariate logistic regression analysis.
Figure 1. Higher night-time mean blood pressure (BP) was associated with (a) higher mean carotid intima–media thickness (IMT) and (b) higher carotid–femoral pulse-wave velocity (PWV).
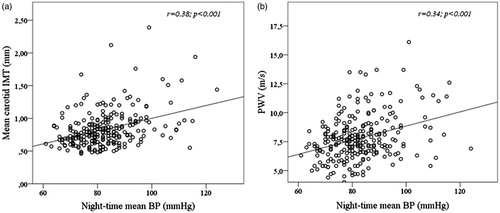
Table 5. Independent covariates of elevated night-time blood pressure (BP) in multivariate logistic regression analysis.