Figures & data
Figure 1. (a) H&E stain of kidney biopsy shows mononuclear cells infiltration of the interstitium, suggesting interstitial nephritis. (b) H&E stain of kidney biopsy shows tubular necrosis.
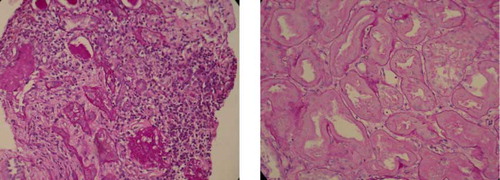
Figure 2. Clinical course of this patient. Abbreviations: H/D = hemodialysis, N/V = nausea/vomiting, Cr = creatinine (mg/dL), ALT = alanine aminotransferase (U/L). A-HAV IgM has a cutoff value of 1.2/ABBOTT. Bilirubin is measured in mg/dL.
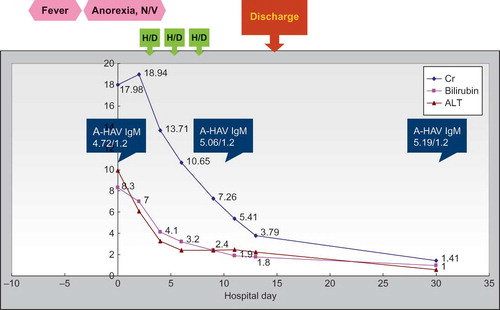
Table 1 Demographic and clinco-pathological features
Table 2 Clinical characteristics
Table 3 Kidney biopsy (23 out of 48)
Table 4 Renal replacement therapy
Table 5 Outcome