Figures & data
Table 1 Comparative baseline characteristics of hemodialysis patients with normal and elevated cardiac troponin I levels
Table 2 The comparative demographic and clinical parameters of hemodialysis patients with normal and elevated cardiac troponin I levels
Table 3 Comparative laboratory parameters of hemodialysis patients with normal and elevated cardiac troponin I levels
Figure 1. The regression graphic between cardiac troponin I and tumor necrosis factor-alpha.
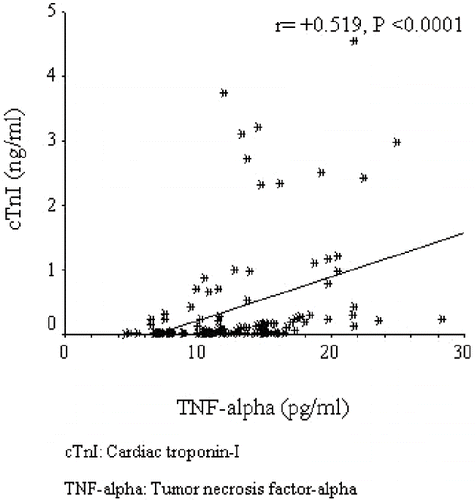
Figure 2. The regression graphic between cardiac troponin I and normalized protein equivalent of total nitrogen appearance.
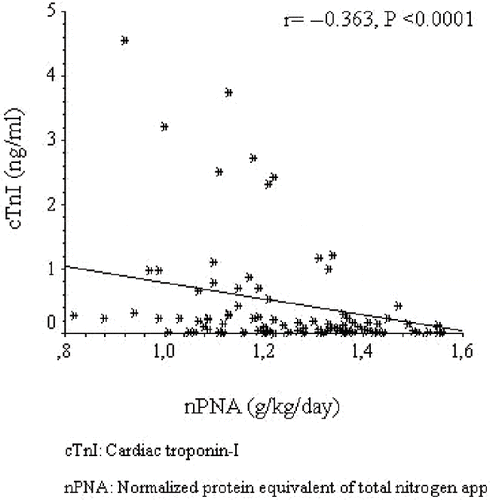
Figure 3. The regression graphic between cardiac troponin I and hemoglobin.
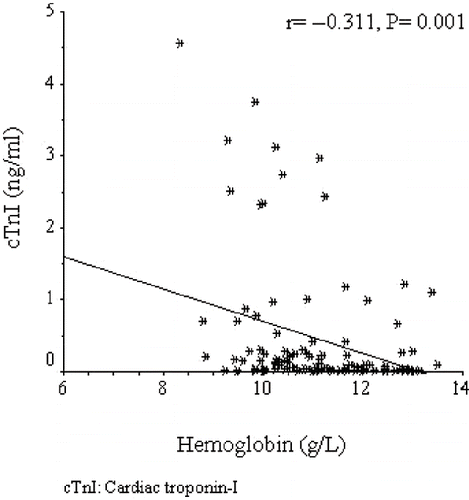
Table 4 Backward multiple linear regression analysis of factors that may be associated with high log cTnI