Figures & data
Figure 1. A schematic representation of the TGF-β-Smad signaling pathway (see text for details).
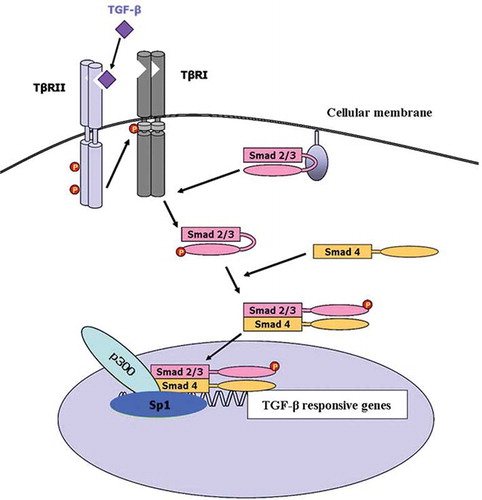
Table 1 Classification and clinical parameters of patients with glomerulonephritis
Figure 2. Sp1 expression in normal human kidney. (a) About 40% of cells within the glomerulus were Sp1-positive, including podocytes, mesangial, endothelial, as well as parietal epithelial cells (arrows). (b) Proximal tubular cells (arrow) were either negative or weakly stained, while distal (arrowhead) and collecting tubules were constantly Sp1 positive. Original magnification ×400.
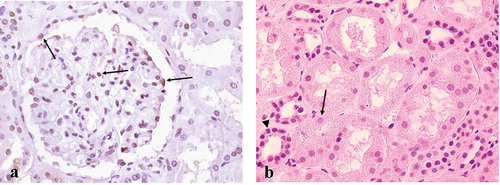
Figure 3. Glomerular (a), proximal tubular (b), distal tubular (c) and collecting tubular (d) staining scores of Sp1 in normal and diseased human kidneys. The error bars represent SE. *p < 0.05, **p < 0.01, ***p < 0.001. For abbreviations, see legend to .
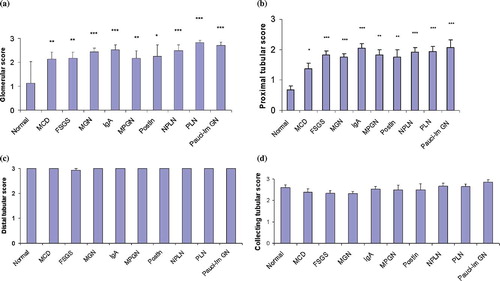
Table 2 Comparison of Sp1 staining intensity in proliferative vs. nonproliferative GNs
Table 3 Comparison of Sp1 staining intensity in secondary vs. primary proliferative GNs
Figure 4. Sp1 immunopositivity in various pathologic lesions of diseased glomeruli: a) hyperplastic lesions (proliferative lupus nephritis, WHO class IV), b) a cellular crescent (arrows) (Wegener granulomatosis), (c) a microadhesion (arrows) (proliferative lupus nephritis, WHO class IV), d) a globally sclerosed glomerulus, and e) a segmental sclerotic lesion (arrows) (IgA nephropathy); (e–g) serial sections of a glomerulus from a patient with IgA nephropathy exhibiting prominent Sp1 (4e), pSmad2/3 (4f) and p300 expression (4g) in cells overlying a sclerotic segment. (Figures 4e and 4g are reproduced from Kassimatis et al. [2006].Citation[17]) Original magnification ×400.
![Figure 4. Sp1 immunopositivity in various pathologic lesions of diseased glomeruli: a) hyperplastic lesions (proliferative lupus nephritis, WHO class IV), b) a cellular crescent (arrows) (Wegener granulomatosis), (c) a microadhesion (arrows) (proliferative lupus nephritis, WHO class IV), d) a globally sclerosed glomerulus, and e) a segmental sclerotic lesion (arrows) (IgA nephropathy); (e–g) serial sections of a glomerulus from a patient with IgA nephropathy exhibiting prominent Sp1 (4e), pSmad2/3 (4f) and p300 expression (4g) in cells overlying a sclerotic segment. (Figures 4e and 4g are reproduced from Kassimatis et al. [2006].Citation[17]) Original magnification ×400.](/cms/asset/438e07d5-bea4-4aab-860c-1f363f975d31/irnf_a_441294_f0004_b.jpg)
Table 4 The percentages of Sp1 immunopositivity incidence in the various lesions of the different groups of GN
Table 5 Correlation of Sp1 with pSmad2/3 and p300 expression at correspondent nephron sites
Table 6 Correlations between immunohistochemical, clinical, and histologic parameters