Figures & data
Table 1 Histopathologic evaluation of the pelviureteral junction in humans [median (min–max)]
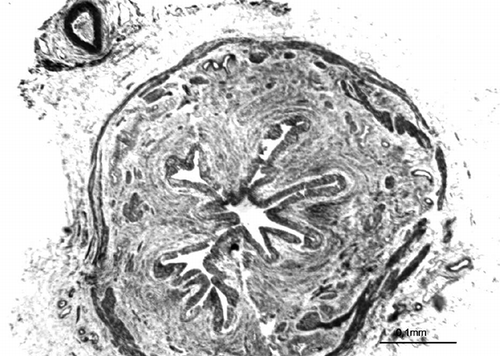
Figure 1. Photomicrograph of C group showing the morphology of a normal pelviureteral junction (Tripple).
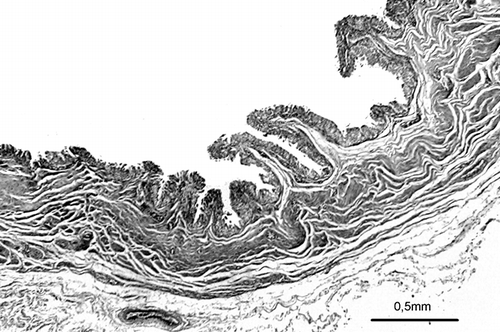
Figure 2. Photomicrograph of PUJO group showing the morphology of thick collagen in an obstructed pelviureteral junction (Tripple).
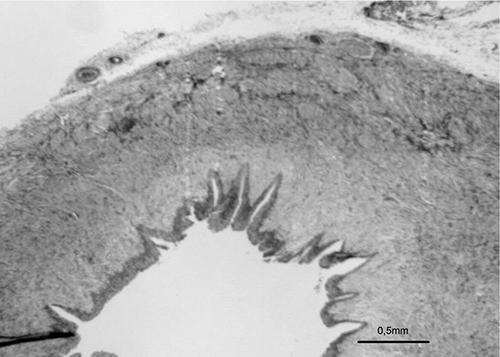
Figure 3. Photomicrograph of PUJO group showing the morphology of tunica muscularis in an obstructed pelviureteral junction (α SMA).
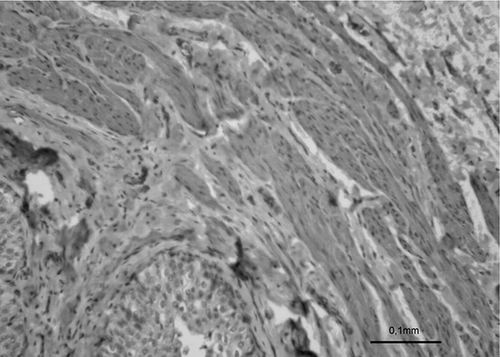
Figure 4. Photomicrograph of PUJO group showing the morphology of uroepithelium in an obstructed pelviureteral junction (H&E).