Figures & data
Table 1 Demographic data of study subjects (n = 88)
Table 2 Variables compared with two groups of 1500 ml and 2000 ml
Table 3 Summary statistics for various linear combinations
Table 4 Six prediction methods for original observed volume
Figure 1. Plot of study data and new axis of Z (new axis) for alternative A.
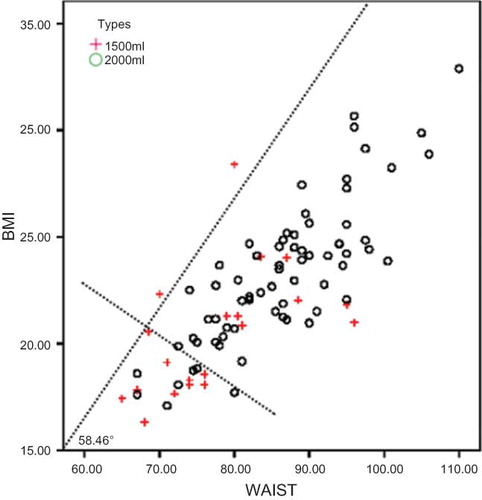
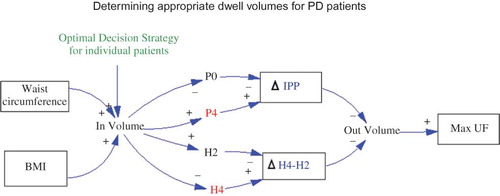
Figure 2. Relationships of causes and effects obtaining appropriate PD dwell volume to maximum UF volumes for continuous ambulatory peritoneal dialysis (CAPD) treatment.