643
Views
9
CrossRef citations to date
0
Altmetric
Laboratory Studies

Pretreatment with Oxygen Protects Rat Kidney from Cisplatin Nephrotoxicity

, , , , , , , , & show all
Pages 234-242 | Received 10 Sep 2009, Accepted 13 Dec 2009, Published online: 03 Mar 2010

Figures & data

Figure 1. Percent of oxygen gas in the chamber. There was a high degree of correlation (p < 0.001, R2 = 0.93) between experimental data (gray triangles) and data predicted by a mathematic formula, which was equated for this purpose (black squares). It has been presupposed in this equation that the oxygen source has 100% purity and that the initial O2% in the chamber is 21%. It is obvious from equation that mathO2% = VO/V = 1 - 0.79e–Qt/V. According to the correlation, the O2 content of chamber can be equated from mathO2%: O2% = 0.95 (mathO2%) + 15. These equations can be used when there is no access to oxygen meter or for designing new chambers with different volumes (e.g. for human subjects). Abbreviations: mathO2% = O2% predicted by the mathematical formula, VO = volume of oxygen gas in the chamber (lit), V = chamber volume (lit), Q = oxygen flow (lit/min), t = time (min) (i.e., the period of oxygen inflow).

Figure 1.  Percent of oxygen gas in the chamber. There was a high degree of correlation (p < 0.001, R2 = 0.93) between experimental data (gray triangles) and data predicted by a mathematic formula, which was equated for this purpose (black squares). It has been presupposed in this equation that the oxygen source has 100% purity and that the initial O2% in the chamber is 21%. It is obvious from equation that mathO2% = VO/V = 1 - 0.79e–Qt/V. According to the correlation, the O2 content of chamber can be equated from mathO2%: O2% = 0.95 (mathO2%) + 15. These equations can be used when there is no access to oxygen meter or for designing new chambers with different volumes (e.g. for human subjects). Abbreviations: mathO2% = O2% predicted by the mathematical formula, VO = volume of oxygen gas in the chamber (lit), V = chamber volume (lit), Q = oxygen flow (lit/min), t = time (min) (i.e., the period of oxygen inflow).

Figure 2. Plasma creatinine (Cr), urea, malondialdehyde (MDA), and magnesium (Mg) levels in various experimental groups. O2 + CP and O2 + Saline groups were exposed to oxygen (≥95%) 3 h/day for two days. O2 + CP and Air + CP groups received an i.p. injection of 5 mg/kg cisplatin. Rats in the Saline groups received normal saline instead of cisplatin, and Air groups were placed in the same chamber with continuous flow of room air via an aquarium pump. The time of cisplatin injection was 24 hours after exit from the chamber. Plasma samples (also tissue samples) were obtained three days after cisplatin injection. There was no significant difference between the two saline-treated groups. •an out of range data; &p < 0.05; &&&p < 0.005 in comparison with Air+CP group; #not significantly different from O2 + Saline group (also not significantly different from Air + Saline group).

Figure 2.  Plasma creatinine (Cr), urea, malondialdehyde (MDA), and magnesium (Mg) levels in various experimental groups. O2 + CP and O2 + Saline groups were exposed to oxygen (≥95%) 3 h/day for two days. O2 + CP and Air + CP groups received an i.p. injection of 5 mg/kg cisplatin. Rats in the Saline groups received normal saline instead of cisplatin, and Air groups were placed in the same chamber with continuous flow of room air via an aquarium pump. The time of cisplatin injection was 24 hours after exit from the chamber. Plasma samples (also tissue samples) were obtained three days after cisplatin injection. There was no significant difference between the two saline-treated groups. •an out of range data; &p < 0.05; &&&p < 0.005 in comparison with Air+CP group; #not significantly different from O2 + Saline group (also not significantly different from Air + Saline group).

Figure 3. Light microscopy photographs of kidney specimens (H&E, ×400) from Air + Saline (A), O2 + Saline (B), Air + CP (C), and O2 + CP (D) groups. For a brief explanation of groups, see . A and B are normal. In C, which is from a case with severe tubular necrosis, there are some necrotic tubules (arrows). In D, which is from a case with mild tubular necrosis, there is only one necrotic tubule (arrow). There were many fields with normal appearance in this case, which was preconditioned by oxygen administration 24 hours before cisplatin injection.

Figure 3.  Light microscopy photographs of kidney specimens (H&E, ×400) from Air + Saline (A), O2 + Saline (B), Air + CP (C), and O2 + CP (D) groups. For a brief explanation of groups, see Figure 2. A and B are normal. In C, which is from a case with severe tubular necrosis, there are some necrotic tubules (arrows). In D, which is from a case with mild tubular necrosis, there is only one necrotic tubule (arrow). There were many fields with normal appearance in this case, which was preconditioned by oxygen administration 24 hours before cisplatin injection.

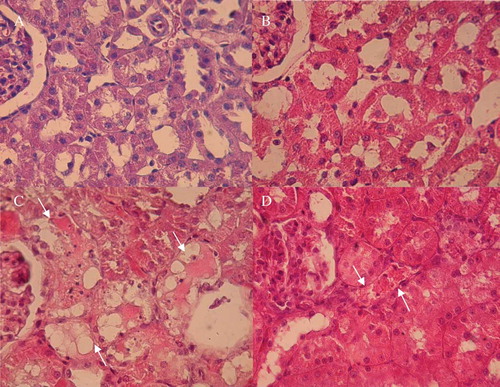
Table 1 Degree of tubular necrosis, luminal cast formation, and congestion and/or hemorrhage in microscopic examination of kidney specimens from different groups

Figure 4. Renal superoxide dismutase (SOD) and catalase (CAT) activities and glutathione (GSH) and malondialdehyde (MDA) levels. For a brief explanation of groups, see . There was no significant difference between the two saline-treated groups. &&p < 0.01; &&&p < 0.005 in comparison with Air + CP group; #not significantly different from O2 + Saline group.

Figure 4.  Renal superoxide dismutase (SOD) and catalase (CAT) activities and glutathione (GSH) and malondialdehyde (MDA) levels. For a brief explanation of groups, see Figure 2. There was no significant difference between the two saline-treated groups. &&p < 0.01; &&&p < 0.005 in comparison with Air + CP group; #not significantly different from O2 + Saline group.

Figure 5. Animal weight loss in various groups. Weight gain expressed as minus data. For a brief explanation of groups, see . &&&p < 0.005 in comparison with Air + CP group; ap = 0.08 vs. Air + CP group.

Figure 5.  Animal weight loss in various groups. Weight gain expressed as minus data. For a brief explanation of groups, see Figure 2. &&&p < 0.005 in comparison with Air + CP group; ap = 0.08 vs. Air + CP group.

Reprints and Corporate Permissions

Please note: Selecting permissions does not provide access to the full text of the article, please see our help page How do I view content?

To request a reprint or corporate permissions for this article, please click on the relevant link below:

Academic Permissions

Please note: Selecting permissions does not provide access to the full text of the article, please see our help page How do I view content?

Obtain permissions instantly via Rightslink by clicking on the button below:

If you are unable to obtain permissions via Rightslink, please complete and submit this Permissions form. For more information, please visit our Permissions help page.