Figures & data
TABLE 1. Demographic clinical and biochemical properties of patients and control group
TABLE 2. Parameters of pro-oxidant and antioxidants between patients and controls
FIGURE 1. Comparison of SOD levels between dialysis patients and control group.
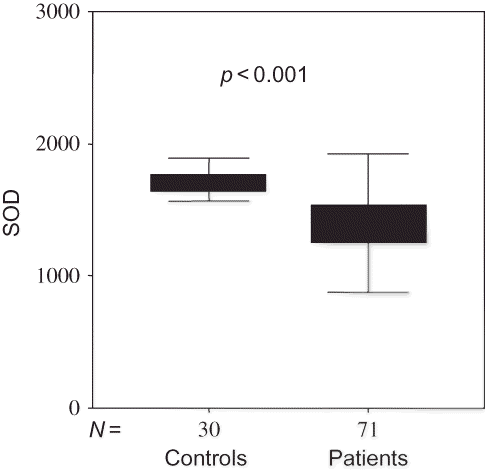
TABLE 3. Oxidative stress and echocardiographic data
FIGURE 2. Comparison of malondialdehyde levels between HD, CAPD, and control groups.
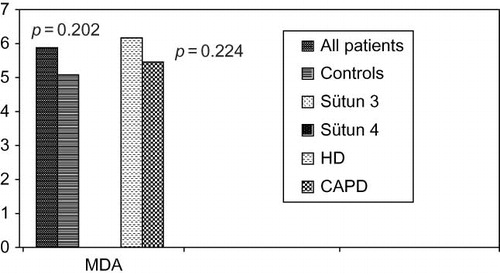
FIGURE 3. Comparison of glutathione peroxidase levels between HD, CAPD, and control groups.
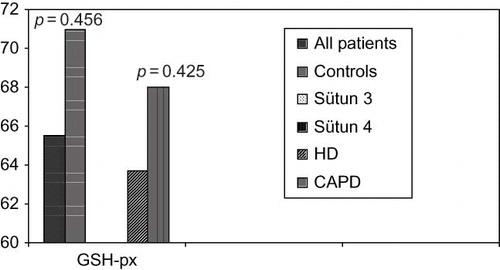
FIGURE 4. Comparison of superoxide dismutase levels between patients on HD, SAPD, and control groups.
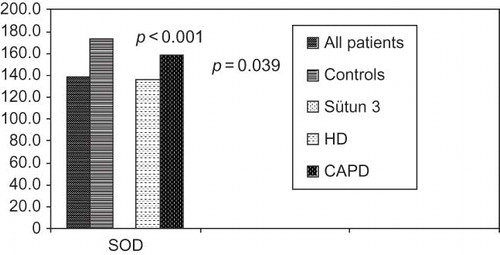
TABLE 4. Results of Pearson's correlation
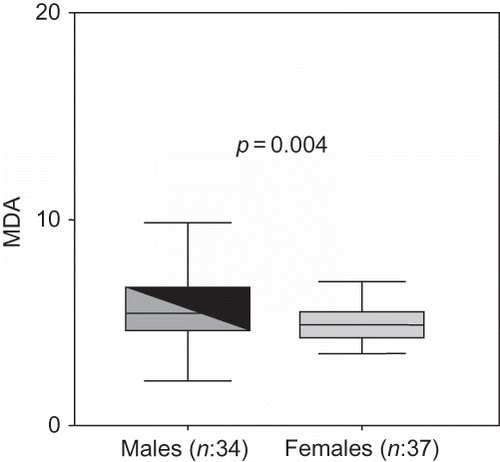
FIGURE 5. MDA levels of male and female patients.