Figures & data
FIGURE 1. Polyacrylamide gel electrophoresis of PCR products after restriction digestion. Each genotype of C-509T was clearly defined by the method described. 1,2:CC genotype; 3:CT genotype; 4: TT genotype; M: Marker.
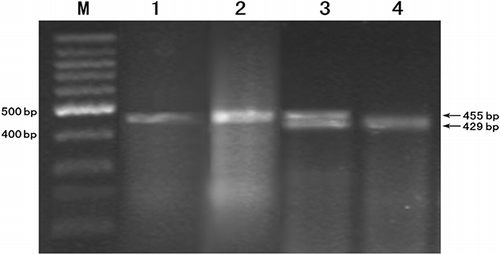
TABLE 1. Comparison on general condition in PNS patients and normal controls
TABLE 2. Comparison on general condition in mild TID and servere TID patients
TABLE 3. Compare of the distribution of the frequencies of TGF-β1 genotype and alleles in PNS and control (n, %)
TABLE 4. Compare of the distribution of the frequencies of TGF-β1 genotype and alletes in the patients with mild TID and severe TID (n, %)
TABLE 5. A logistic regression analysis on risk factors of TID in PNS patients
FIGURE 2. Serum concentration of TGF-β1 in normal controls and patients with mild and severe TID.
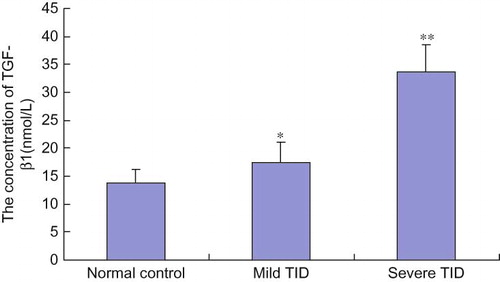
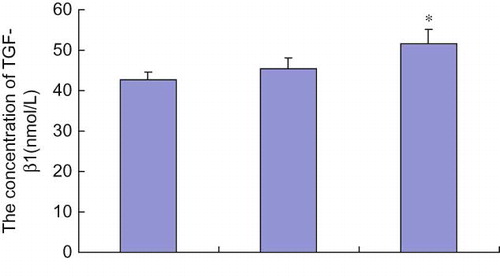
FIGURE 3. Serum concentration of TGF-β1 in different TGF-β1 genotype group of PNS patients.