Figures & data
TABLE 1. Experimental protocol of rat groups
TABLE 2. Differences between weights of the rats after waiting period
TABLE 3. The effects of ovariectomy on total glutathione (GSH), lipid peroxidation levels, enzymatic activities of LPO, catalase (CAT), and superoxide dismutase (SOD) of sepsis, diabetes, and sepsis and diabetes on kidney tissues of rats
FIGURE 1. Blood glucose levels of the rats after waiting period.
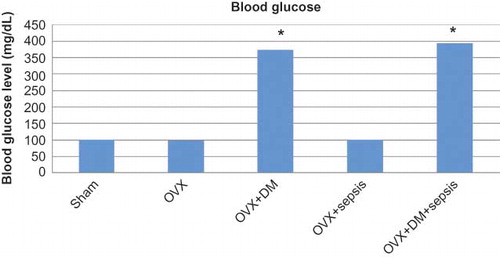
FIGURE 2. Serum levels of BUN (A) and creatinine (B) in experimental groups.
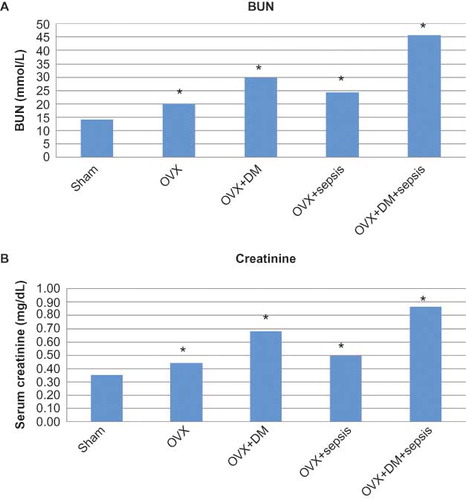
FIGURE 3. Light microscopy of kidney in the control (A, B) and the ovariectomy group (C, D). gl, glomerulus; d, distal tubules; p, proximal tubules; t, collecting tubules; dye: hematoxylin–eosin; magnification bars: 40 μm.
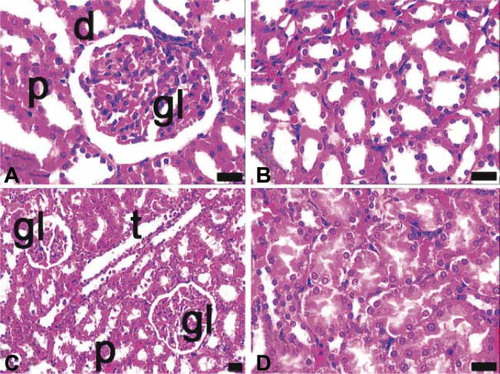
FIGURE 4. Light microscopy of kidney in the diabetes (A, B) and sepsis group (C, D). gl, glomerulus; p, proximal tubules; asterisk, reduced glomerulus; underlined asterisk, inflammatory cell infiltrations at nodular form; arrow, proximal tubules with apical degenerations; arrow with double head, inflammatory cell infiltrations at diffuse form; asterisk with white filling, proximal tubule with integrity loss; arrow head, eosinophilic accumulations in intertubular area; dye: hematoxylin–eosin; magnification bars: 40 μm.
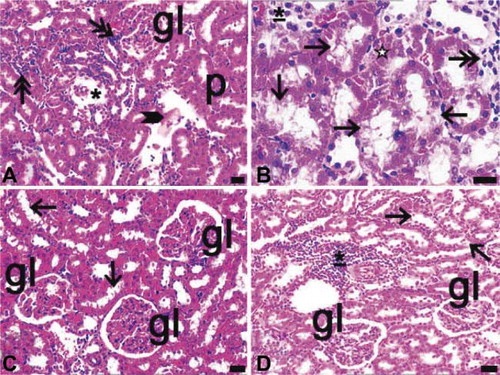
FIGURE 5. Light microscopy of kidney in the ovariectomy and diabetes (A, B) and ovariectomy and sepsis (C, D), and diabetes and sepsis group (E, F). gl, glomerulus; asterisk, glomerulus with segmental necrosis; double asterisks, inflammatory cell infiltrations at diffuse form; thick arrow, inflammatory cell infiltrations at nodular form; thin arrow, cells of distal tubules with hydropic degenerations ; arrow with double head and inset of E, proximal tubules with apical degenerations, asterisk with white filling, glomeruli which their capillaries were congested arrowhead, erythrocytes in inter-tubular area; dye: hematoxylin–eosin; magnification bars: 40 μm.
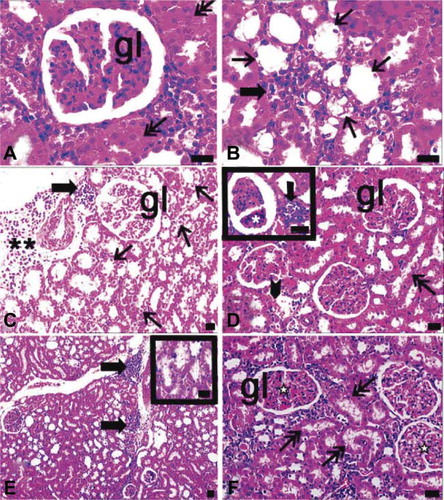
FIGURE 6. Light microscopy of kidney in the ovariectomy, sepsis and diabetes group (A–F). gl, glomerulus; sg, sclerotic glomeruli; gn, glomerulonephritis; asterisk, proteinous accumulations in inter-tubular area and urinary space; double asterisks, inflammatory cell infiltrations at diffuse form; underlined asterisk, proximal tubule with integrity loss; thick arrows, proliferating extra-mesangial cells in cortex; thin arrow, giant cells in cortex; inset of A, glomeruli with dilated capillary; inset of C, reduced glomerulus; inset of E, degenerated tubules; dye: hematoxylin–eosin; magnification bars: 40 μm.
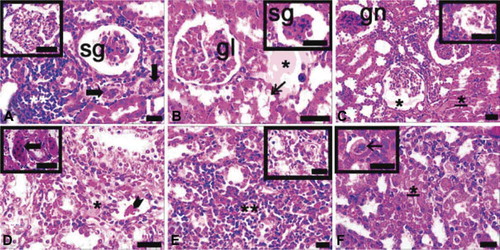
FIGURE 7. Immunohistochemical staining of NF-κB (p65) in tissue sections of control (A, B), ovariectomy (C, D), sepsis (E, F), and diabetes (G, H) groups. gl, glomerulus; d, distal tubules; p, proximal tubules; t, collecting tubules; positivity was seen in especially cytoplasmic pattern of tubular cells in ovariectomy (C, D), sepsis (E, F; the most expression of p65), and diabetes (G, H) groups; magnification bars: 30 μm.
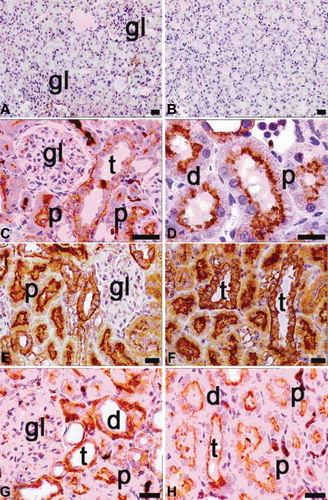
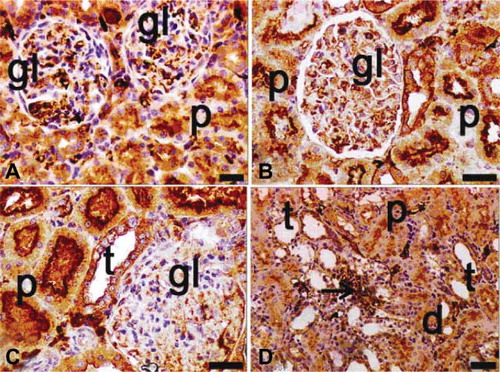
FIGURE 8. Immunohistochemical staining of NF-κB (p65) in tissue sections of ovariectomy–diabetes (A, B), ovariectomy–sepsis (C, D), and diabetes–sepsis (E, F) groups. gl, glomerulus; d, distal tubules; p, proximal tubules; t, collecting tubules; arrows indicate extramesangial cells with p65 positive nuclei and cytoplasm; positivity was seen in especially cytoplasmic pattern of tubular cells, both cytoplasmic and nuclear pattern of extramesangial cells and rarely in glomeruli. The most expression of p65 was found in diabetes–sepsis group; magnification bars: 30 μm.
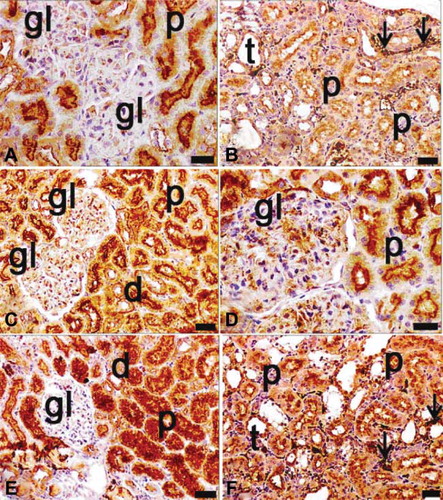
FIGURE 9. Immunohistochemical staining of NF-κ B (p65) in tissue sections of ovariectomy–diabetes and sepsis group (A–D). gl, glomerulus; d, distal tubules; p, proximal tubules; t, collecting tubules; arrows indicate extramesangial cells with p65 positive nuclei and cytoplasm; positivity was seen in especially cytoplasmic pattern of tubular cells, both cytoplasmic and nuclear pattern of extramesangial cells and commonly in glomeruli. The highest expression of p65 was found in this group among the all groups; magnification bars: 30 μm.