Figures & data
TABLE 1. Baseline characteristics of the patients according to peritoneal transport type (n = 551)
TABLE 2. Determinants of baseline D/P Cr in patients on peritoneal dialysis
FIGURE 1. Longitudinal values of D/P creatinine.
FIGURE 2. Longitudinal values of D/P creatinine in patients with initial different peritoneal transport status.
FIGURE 3. Patient survival curves. L, low transporter; LA, low-average transporter; HA, high-average transporter; H, high transporter.
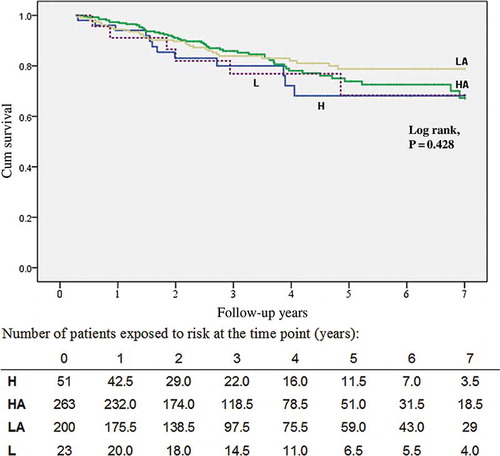
TABLE 3. Cox regression analysis of the overall risk of all-cause mortality according to baseline prognostic factors in maintenance PD patients (n = 551)