Figures & data
FIGURE 1. Ang II enhances renal cortical tissue expression of Ets-1. RNAs were extracted from renal cortical tissues of normal saline (n = 2), Ang II (n = 2), and Ang II + telmisartan (n = 2) -receiving mice and probed for Ets-1 and tubulin by RT-PCR.
FIGURE 2. Ang II-induced tubular cell Ets-1 expression is associated with tubular cell expression of PAI-1, p21, and MCP-1. Renal cortical sections from normal saline (n = 4), Ang II (n = 4), or Ang II + telmisartan (n = 4) -receiving mice were immunolabeled for Ets-1, PAI-1, p21, and MCP-1. Representative microphotographs showed increased distal tubular cell expression of Ets-1 in Ang II-receiving mice (B) when compared with renal cortical sections from normal saline (A) and Ang II + telmisartan (C). Ang II also enhanced the distal tubular cell expression of PAI (E); however, AT1-receptor blockade attenuated this effect of Ang II (F). Similarly, Ang II increased the distal tubular cell expression of p21 (H); however, telmisartan attenuated this effect of Ang II (I). Ang II also promoted the expression of MCP-1 by distal tubular cells (K), which was inhibitied by telmisartan (L).
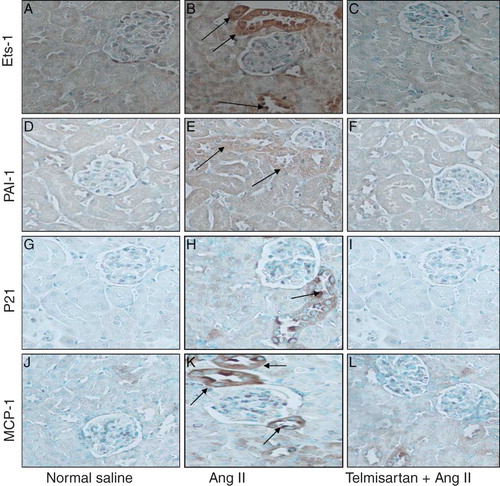
FIGURE 3. Ang II enhances MDCK cell mRNA expression of Ets-1. Equal numbers of MDCK cells were incubated in media containing either buffer, Ang II (10−8 M), losartan (LOS, 10−7 M), Ang II + LOS, for 24 h. Subsequently, cells were harvested, RNA extracted, and probed for Ets-1 by RT-PCR.
FIGURE 4. Ang II enhances PAI-1 expression in MDCK cells. Equal numbers of MDCK cells were incubated in media containing either buffer, Ang II (10−8 M), losartan (LOS, 10−7 M), or Ang II + losartan, for 24 h. At the end of the incubation period, cells were washed and proteins extracted. Western blots were prepared and probed for PAI-1. The upper panel shows the effect of Ang II on tubular cell expression of PAI-1. The lower panel shows actin content of cells under similar conditions.
FIGURE 5. Ang II promotes the distal tubular cell expression of p21. Equal numbers of MDCK cells were incubated in media containing either buffer, Ang II (10−8 M), losartan (LOS, 10−7 M), or Ang II + losartan, for 24 h. At the end of the incubation period, cells were harvested and proteins extracted. Western blots were prepared and probed for p21. The upper panel shows the effect of Ang II on tubular cell expression of p21. The lower panel shows actin content of cells under similar conditions.