564
Views
7
CrossRef citations to date
0
Altmetric
Laboratory Studies

Recombinant human erythropoietin treatment protects the cardio-renal axis in a model of moderate chronic renal failure

, , , , , , , , , , , , & show all
Pages 1073-1080 | Received 17 Dec 2009, Accepted 10 Jul 2010, Published online: 23 Sep 2010

Figures & data

Table 1.  Genes of interest and endogenous controls used in the present RT-qPCR study

Table 2.  Effects of rhEPO treatment in renal and hematological data in a rat model of moderate CRF

Table 3.  Effects of rhEPO treatment on blood pressure, body and tissue weights, and peripheral catecholamine measures in a rat model of moderate CRF, at the final time (15 weeks)

Figure 1. Effects of rhEPO treatment on heart rate and left ventricle sympathetic nervous system activity in a rat model of moderate CRF, at the final time: heart rate (A) and left ventricle content in norepinephrine (B) and epinephrine (C). Results are means ± SEM (seven rats per group): ap < 0.05 and aaap < 0.001 versus the control group; bp < 0.05 versus the CRF group.
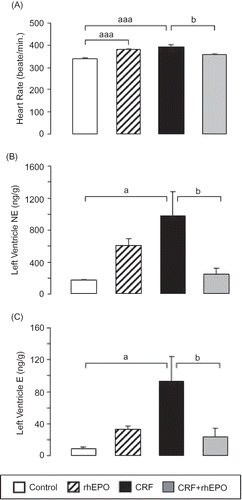
Figure 1. Effects of rhEPO treatment on heart rate and left ventricle sympathetic nervous system activity in a rat model of moderate CRF, at the final time: heart rate (A) and left ventricle content in norepinephrine (B) and epinephrine (C). Results are means ± SEM (seven rats per group): ap < 0.05 and aaap < 0.001 versus the control group; bp < 0.05 versus the CRF group.

Figure 2. Effects of rhEPO treatment on trophism/proliferation markers: heart/body weight (A); kidney/body weight (B); and serum-transforming growth factor-1beta (C) in a rat model of moderate CRF, at the final time. Results are means ± SEM (seven rats per group): ap < 0.05 versus the control group; bp < 0.05 versus the CRF group.
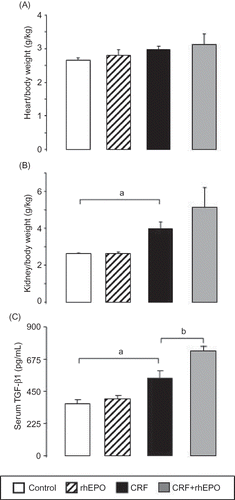
Figure 2. Effects of rhEPO treatment on trophism/proliferation markers: heart/body weight (A); kidney/body weight (B); and serum-transforming growth factor-1beta (C) in a rat model of moderate CRF, at the final time. Results are means ± SEM (seven rats per group): ap < 0.05 versus the control group; bp < 0.05 versus the CRF group.
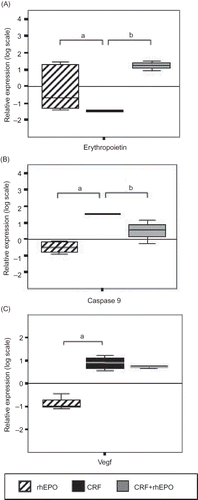
Figure 3. Relative kidney gene expression quantification for erythropoietin (A); Caspase 9 (B); and Vegf (C) in rhEPO, CRF, and CRF + rhEPO groups comparatively to control group (zero line). Results are means ± SEM (seven rats per group): ap < 0.05 versus the control group; bp < 0.05 versus the CRF group.

Figure 3. Relative kidney gene expression quantification for erythropoietin (A); Caspase 9 (B); and Vegf (C) in rhEPO, CRF, and CRF + rhEPO groups comparatively to control group (zero line). Results are means ± SEM (seven rats per group): ap < 0.05 versus the control group; bp < 0.05 versus the CRF group.

Reprints and Corporate Permissions

Please note: Selecting permissions does not provide access to the full text of the article, please see our help page How do I view content?

To request a reprint or corporate permissions for this article, please click on the relevant link below:

Academic Permissions

Please note: Selecting permissions does not provide access to the full text of the article, please see our help page How do I view content?

Obtain permissions instantly via Rightslink by clicking on the button below:

If you are unable to obtain permissions via Rightslink, please complete and submit this Permissions form. For more information, please visit our Permissions help page.