Figures & data
Figure 1. Expression of CD19+CD5+B cells in GC and cap covering the top of the nodule of lymphoid tissue. In IgAN, there is more expression, whereas little to no staining was detected with the control. Arrows indicate positive cell staining (A) RBITC-conjugated CD19 (red); (B) FITC-conjugated CD5 (green); (C) double staining of CD19+CD5+B cells (yellow) on the surface of nodules of lymphoid tissue, confocal laser, ×100; (D) double staining of CD19+CD5+B cells in germinal center, confocal laser, ×630).
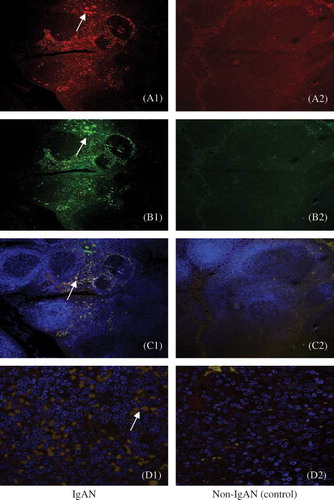
Figure 2. Expression of IgA1-positive cells in tonsillar tissue can be seen in cap covering the top of the nodule of lymphoid tissue and the subepithelial tissue (green). In IgAN, there is more expression, whereas little to no staining was detected with the control. Arrows indicate positive cell staining in (A) cap covering the top of the nodule of lymphoid tissue (fluorescence microscope, ×100) and (B) subepithelial tissue (fluorescence microscope, ×200).
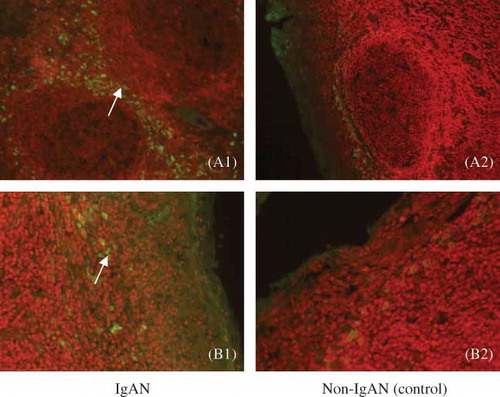
Figure 3. Comparison of the expression of CD19+CD5+B cells and IgA1-positive cells of IgAN and non-IgAN patients (control). The Wilcoxon signed-rank test has shown a significant statistical difference between IgAN and control patients.
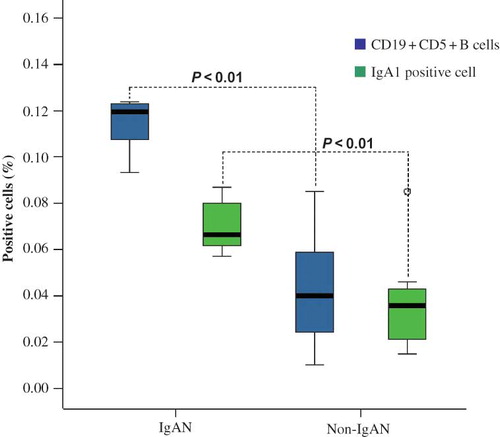
Figure 4. Correlation analysis of CD19+CD5+B cells and IgA1-positive cells in IgA in the tonsils of nephropathy patients. The drawn line represents the ideal of identical results in the two observers (r = 0.778, p = 0.023).
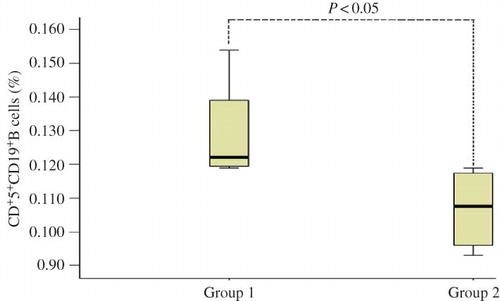
Figure 5. The correlation between group 1 (percentage of CD19+CD5+B cells) and group 2 (renal pathological changes) in the tonsils of IgA nephropathy patients.