Figures & data
Figure 1. Transfection efficiency in different groups at the titer of 107 TU/mL: (A) control group; (B) pSC-GFP group; (C) pSC-GFP/Col I group. The unit for the values in x-axis is channel. The transfection efficiency was 0.02% in control group, and that in pSC-GFP group and pSC-GFP/Col I group was similar. These findings suggested Col I shRNA did not affect the transfection.
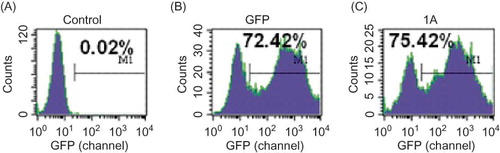
Figure 2. mRNA expression of Col I in mesangial cells (RT-PCR). 1, marker; 2, blank; 3, pSC-GFP; 4, pSC-GFP/Col I.
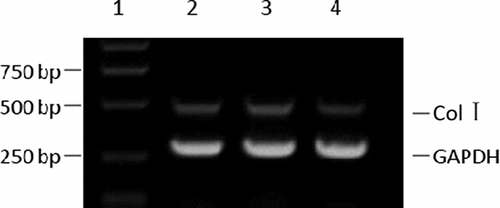
Table 1. OD in different groups (RT-PCR)
Figure 3. Protein expression of Col I in different groups was detected by Western blot. The protein expression of pSC-GFP group and pSC-GFP/Col I group was normalized by that of control group.
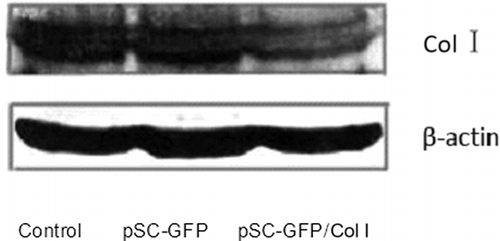
Table 2. OD in the detection of cell proliferation by MTT assay
Figure 4. Apoptosis through Annexin V/PE staining: (A) control group; (B) pSC-GFP group; (C) pSC-GFP/Col I group. The threshold limit value was set at 102 channel. The sum of proportions of cells in the upper left and right quadrants was the proportion of apoptotic cells. The proportion of apoptotic cells in pSC-GFP group and pSC-GFP/Col I group was markedly higher than that in control group.
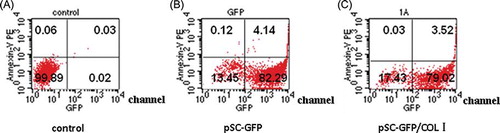
Table 3. Proportion of cells in different phases after 24 h, 48 h, and 72 h of transfection
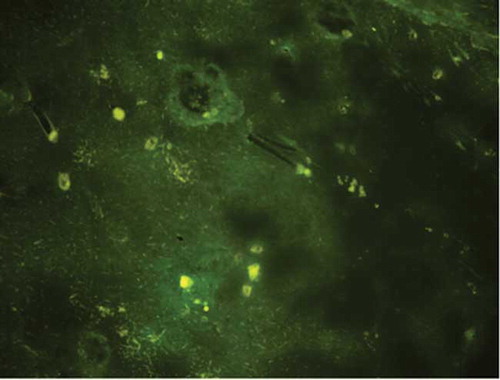
Figure 5. Representative photograph of the kidney after renal injection from inverted fluorescence microscopy (200×) Lentivirus-mediated Col shRNA delivery was performed through injection into renal cortex and green fluorescent protein was determined under an inverted fluorescence microscope which reflects the feasibility of lentivirus-mediated shRNA delivery through renal parenchyma injection.