Figures & data
Table 1. Clinical characteristics and baseline laboratory values in patients recruited in the first and second studies
Figure 1. Plasma predialysis HNA proportions during EVAL and CTA treatments. HNA indicates HNA-1 + HNA-2. Plasma HNA proportions showed no obvious difference between the baseline, after EVAL treatment, and after CTA treatment.
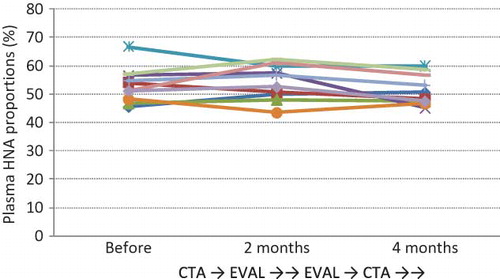
Figure 2. Changes in predialysis AOPP levels during EVAL and CTA treatments. The plasma levels of AOPP decreased after 2 months of EVAL treatment and then increased again after the following 2 months of CTA treatment. Data are presented as mean ± SD.
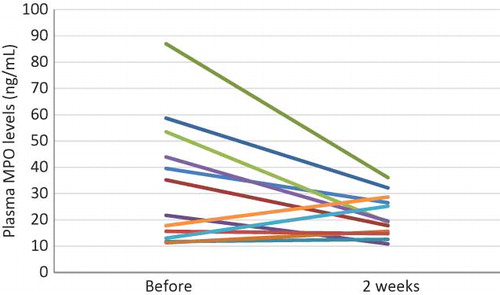
Figure 3. Effects of 2 weeks of EVAL treatment on predialysis MPO levels. The plasma MPO levels immediately before HD significantly decreased after 2 weeks of EVAL treatment.