Figures & data
Table 1. Baseline characteristics of subjects without CKD or CVD and with CKD and/or CVD
Table 2. Baseline characteristics of four groups
Table 3. Comparison of biomarker levels in the investigated participants
Figure 1. Circulating levels of TNFα, PTX3, hsCRP, and MCP-1 in CKD patients with CVD with their eGFR ≥ 30 mL/min/1.73 m2 (N = 35) and <30 mL/min/1.73 m2 (N = 14).
Figure 2. Receiver characteristic operating curves for differentiating the presence of CVD in advanced CKD patients (eGFR < 30 mL/min/1.73 m2) on the basis of the circulating levels of (A) PTX3, (B) TNFα, and (C) hsCRP (area under the curve = 0.664, 0.507, and 0.318, respectively).
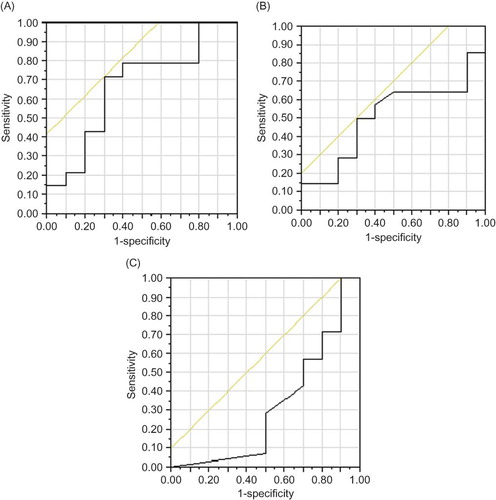
Table 4. Factors independently associated with the presence of CVD in advanced CKD patients (eGFR < 30 mL/min/1.73 m2)