Figures & data
Figure 1. Changes of biochemical indexes of renal function in rabbits (mean ± SD, n = 6).
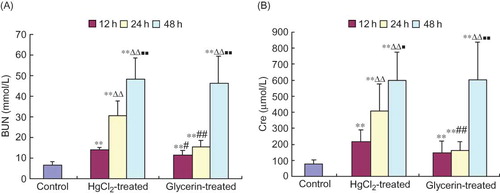
Figure 2. Change of spleen histomorphology in two rabbit models of ARF (hematoxylin and eosin staining, ×100). (A) Control group; (B) HgCl2-treated group at 12 h; (C) HgCl2-treated group at 24 h; (D) HgCl2-treated group at 48 h; (E) glycerin-treated group at 12 h; (F) glycerin-treated group at 24 h; (G) glycerin-treated group at 48 h. Arrows show congestion in C, E, and F and trabeculae lienis in D and G.
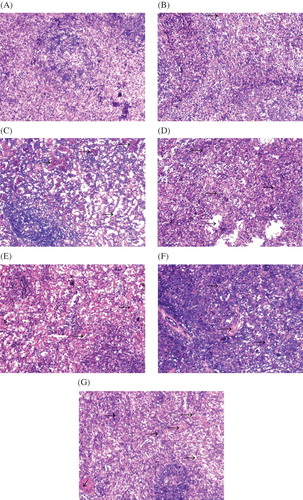
Figure 3. MDA content is increased and SOD activity decreased in spleen homogenates of rabbit models of ARF (mean ± SD, n = 6).
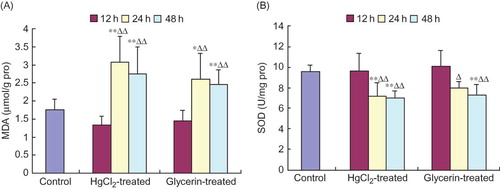
Figure 4. NO content and NOS activity were elevated in spleen homogenates of rabbit models of ARF (mean ± SD, n = 6).
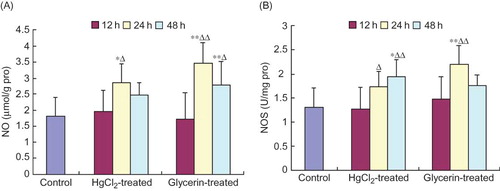
Figure 5. Changes of MPO activity in spleen homogenate of rabbit models of ARF (mean ± SD, n = 6).
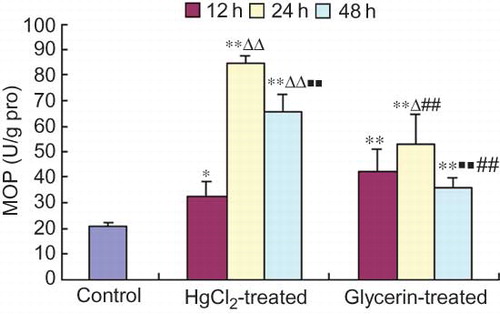
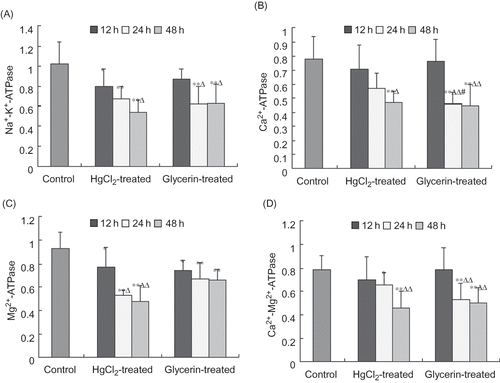
Figure 6. ATPase activities were significantly suppressed in the spleen homogenate of rabbit models of ARF (µmolPi/mg.pro/h, mean ± SD, n = 6).