Figures & data
Table 1. Comparisons of age and sex constitution in Lee’s gradation groups in IgAN patients.
Table 2. Comparisons of clinical dates in Lee’s gradation groups in IgAN patients.
Figure 1. The comparison of the number of urinary podocytes (10 × 20). (A) Control group. (B) IgAN patient group. [(B1–B5) represent the comparison of the number of podocytes in Lee’s I–V groups in IgAN]. Arrows indicate the representative podocytes.
![Figure 1. The comparison of the number of urinary podocytes (10 × 20). (A) Control group. (B) IgAN patient group. [(B1–B5) represent the comparison of the number of podocytes in Lee’s I–V groups in IgAN]. Arrows indicate the representative podocytes.](/cms/asset/c0f933f4-1ba3-4e17-b3ae-1bc45e868f49/irnf_a_643352_f0001_b.jpg)
Table 3. Comparison of urinary podocytes excretion count.
Figure 2. Electron microscopy studies in podocyte and PCX expression in Lee’s classification. (A1–A5) represent the morphology of podocyte and foot process changes in Lee’s I–V grades of IgAN (electron microscopy, ×10,000). Electron microscopy shows varying degrees of matrix and mesangial proliferation and a series of podocyte changes, including podocyte body swelling and vacuoles of varying sizes in cytoplasm [(A1) indicated by red arrow]; irregular shape of foot processes with enlargement in the end of primary processes and adhesion to capillary basement membrane, or large amounts of tiny finger-like protrusions in second processes, namely “the formation of microvillus” [(A2) indicated by red arrow]; foot processes adhesion and emerging into high-density electron mass attached to the outside of the basement membrane [(A3) indicated by red arrow]; and podocyte foot strip or fall off from glomerular basal membrane [(A4, A5) indicated by red arrow]. (B1–B5) show glomerular PCX expression in Lee’s I–V grade groups (optical microscope ×200). In Lee’s I grade group, PCX was stained brown and evenly distributed along the glomerular capillary loops; no PCX expression was detected in renal tubules and Bowman’s capsule. In Lee’s grade groups II–V, glomerular PCX expression was unevenly distributed with significant regional decrease of staining, or segmental loss of staining, or total loss of staining in the crescent formation area or the sclerosis area.
![Figure 2. Electron microscopy studies in podocyte and PCX expression in Lee’s classification. (A1–A5) represent the morphology of podocyte and foot process changes in Lee’s I–V grades of IgAN (electron microscopy, ×10,000). Electron microscopy shows varying degrees of matrix and mesangial proliferation and a series of podocyte changes, including podocyte body swelling and vacuoles of varying sizes in cytoplasm [(A1) indicated by red arrow]; irregular shape of foot processes with enlargement in the end of primary processes and adhesion to capillary basement membrane, or large amounts of tiny finger-like protrusions in second processes, namely “the formation of microvillus” [(A2) indicated by red arrow]; foot processes adhesion and emerging into high-density electron mass attached to the outside of the basement membrane [(A3) indicated by red arrow]; and podocyte foot strip or fall off from glomerular basal membrane [(A4, A5) indicated by red arrow]. (B1–B5) show glomerular PCX expression in Lee’s I–V grade groups (optical microscope ×200). In Lee’s I grade group, PCX was stained brown and evenly distributed along the glomerular capillary loops; no PCX expression was detected in renal tubules and Bowman’s capsule. In Lee’s grade groups II–V, glomerular PCX expression was unevenly distributed with significant regional decrease of staining, or segmental loss of staining, or total loss of staining in the crescent formation area or the sclerosis area.](/cms/asset/dcc0e171-863a-4442-8f7c-4c57b430fb52/irnf_a_643352_f0002_b.jpg)
Figure 3. Correlation analysis between the urinary podocyte counts of IgAN patients and the glomerular expression of PCX.
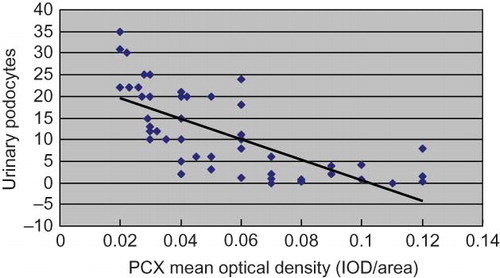
Table 4. Comparison of glomerular and tubular pathological scores in Lee’s various renal pathological classification ( ± s).
Table 5. Correlation analysis between the urinary podocyte excretion and the expression of PCX with the clinical dates and pathological scores.