Figures & data
Figure 1. (A) Group I—Glomerulus, Bowman’s space, and proximal and distal tubular structures can be differentiated (H&E). (B) Group II—Prominence collagen (arrow) staining compared with the control group can be observed in the glomerulus and peritubular region (Masson’s Trichome). (C) Group II—Dilatation and congestion of the vessels (arrow) due to alcohol consumption can be seen (H&E). (D) Renal corpuscle with obscure Bowman’s space (arrow) and foamy-looking tubules (*) can be observed in alcohol consumption rats (H&E).
Note: H&E, hematoxylin–eosin.
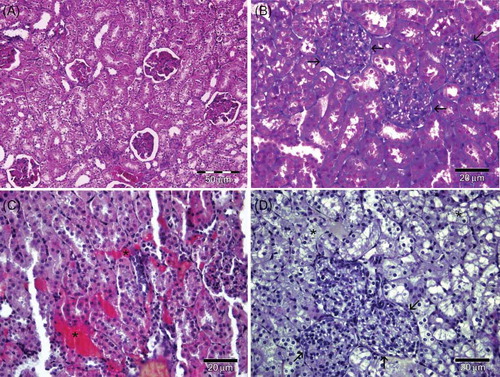
Figure 2. (A) Group IV—Dilatation and congestion of the peritubular vessels (*) and prominent collagen (arrow) staining can be seen (Masson’s Trichome). (B) Group III—Dilatation and congestion peritubular vessels (*) and increased collagen (arrow) staining compared to control group can be seen in administrated vitamin C (Masson’s Trichome). (C) Group I—The presence of eNOS in the glomerulus and tubules can be observed. (D) Group II—The eNOS immunoreactivity is lesser expressed compared with the control.
Note: eNOS, endothelial nitric oxide synthase.
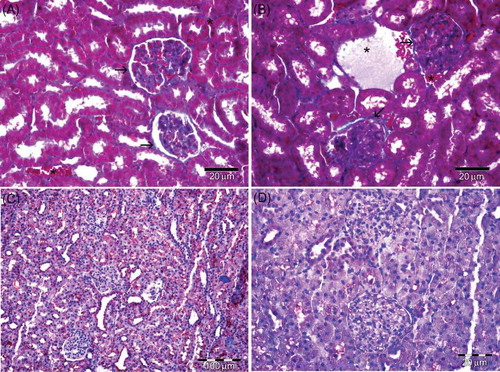
Figure 3. (A) Group IV—eNOS immunoreactivity is observed near the control in melatonin treatment group. (B) Group IV—eNOS immunoreactivity localized especially collector tubules in medulla. (C) Group III—eNOS immunoreactivity is observed near the control in administrated vitamin C. (D) Group II—Negative control.
Note: eNOS, endothelial nitric oxide synthase.
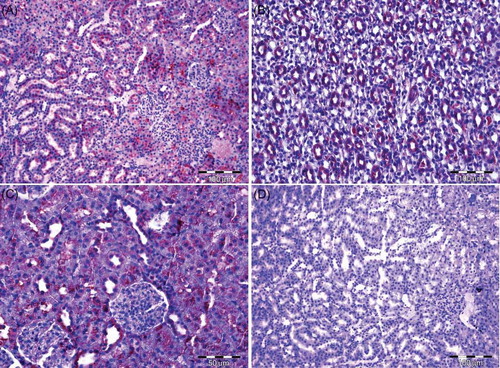
Table 1. MDA and SOD levels and CAT activity in the kidney.