Figures & data
Table 1. Demographic, clinical, and biochemical characteristics of the study patients.
Figure 1. Box plots representing the distribution of serum visfatin levels in control insulin-resistant (IR) and noninsulin-resistant (non-IR) groups; Kruskal–Wallis test (p = 0.00).
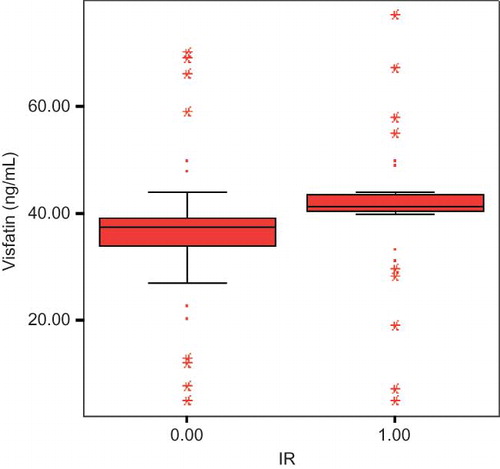
Figure 2. Histogram for evaluation of data distribution for serum visfatin levels.
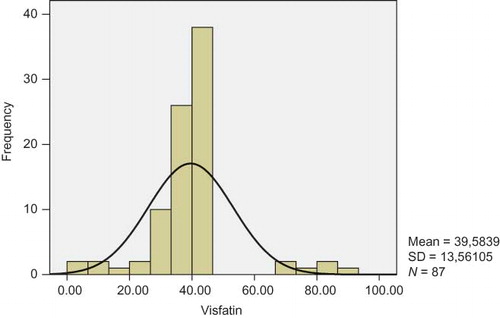
Table 2. Stepwise linear regression analysis with visfatin as dependent variable (n = 87, r2 = 0.68).
Table 3. Stepwise linear regression analysis with LVMI as dependent variable (n = 87, r2 = 0.54).