Figures & data
Figure 1. Hematoxylin and eosin staining of peritoneal tissues. The monolayer of mesothelial cells that covers the surface of peritoneum in normal mice (A). Chlorhexidine gluconate (CG) injection induced significant thickening of the peritoneum at day 8 (B) and day 16 (C) in WT mice. In SCID mice, the peritoneal tissues became thicker than that of WT mice at day 8 (D) and day 16 (E). Bars indicate the thickness of the submesothelial compact zone. Magnification, ×100. The average thickness of the submesothelial compact zone in WT control mice (WT-control), CG-injected WT mice (WT-CG), SCID-control mice (SCID-control), and CG-injected SCID mice (SCID-CG) at day 16 (F). Data are presented as the mean ± SD. a: p < 0.01 versus WT-control; b: p < 0.01 versus SCID-control; c: p < 0.01 versus WT-CG.
Table 1. The number of T lymphocytes, B lymphocytes, or macrophages in the submesothelial layer.
Figure 2. Immunohistochemistry for CD3, CD45R, and F4/80 at day 16. Immunohistochemical detection of CD3-positive (A), CD45R-positive (C) and F4/80-positive (E) cells in the peritoneum of CG-injected WT mice. CG-injected SCID mice were also analyzed for the presence of CD3-positive (B), CD45R-positive (D), and F4/80-positive (F) cells. Magnification, ×200.
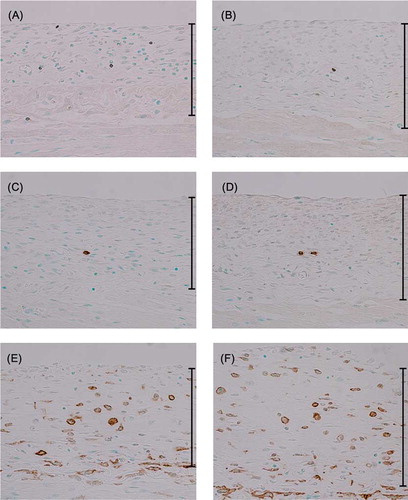
Figure 3. Immunohistochemistry for TGF-β. In CG-injected WT mice, TGF-β-positive cells are present in thickened submesothelial compact zone (A). In CG-injected SCID mice, the number of TGF-β-positive cells is increased compared to CG-injected WT mice (B). Magnification, ×200. The number of TGF-β-positive cells was determined in 10 fields (magnification, ×400) selected at random in the submesothelial region (C). Data represent the mean ± SD. a: p < 0.01 versus control-treated WT mice (WT-control); b: p < 0.01 versus WT-control and CG-injected WT mice (WT-CG).