Figures & data
Figure 1. Comparison between the effects of OA infusion in anesthetized rats with control animals on GFR (A), MAP (B), and Na+ excretion rate (C). OA was administered at 90 μg h−1 for 1 h 30 min during the treatment period. Values are presented as means for each 30-min collection; vertical bars indicate SEM of means (n = 6) in each group.
Note: *p < 0.05 in comparison with control animals.
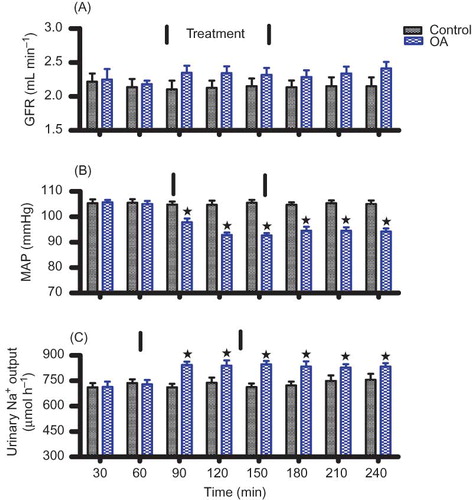
Figure 2. Comparison between the effects of OA treatment twice every third day for 5 weeks with control animals on MAP (A) and Na+ excretion rates (B) in conscious rats. Values are presented as means for weekly collection; vertical bars indicate SEM of means (n = 6) in each group.
Note: *p < 0.05 in comparison with control animals.
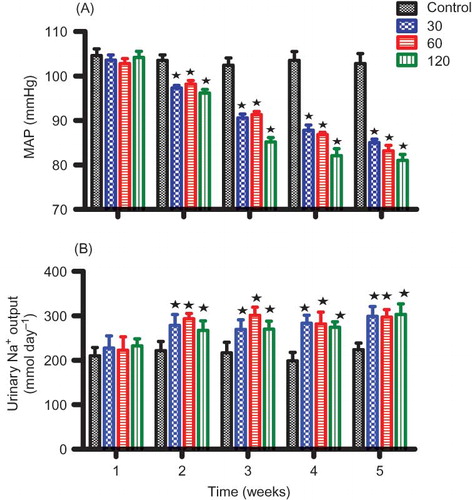
Table 1. Terminal plasma biochemical parameters of control and rats administered OA twice every third consecutive day for 5 weeks (n = 6 in all groups).
Figure 3. Comparison between the effects of OA infusion in anesthetized rats with control animals on FENa prox, FENa dist (A) and FELi (B). OA was administered at 90 μg h−1 for 1 h 30 min during the treatment period. Values are presented as means, and vertical bars indicate SEM (n = 6 in each group).
Note: *p < 0.05 in comparison with control animals.
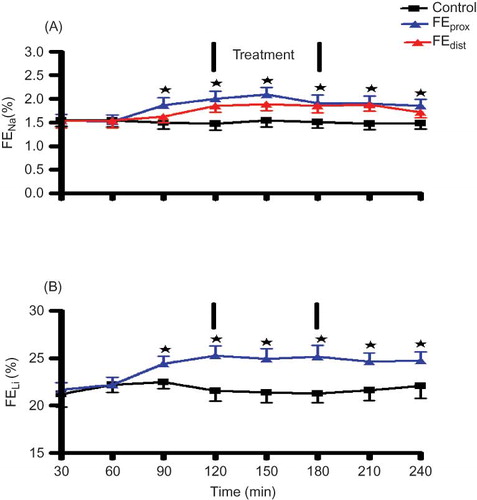
Figure 4. The effects of OA on the viability and/or metabolic activity of HepG2 (A), HEK293 (B), and MDBK (C) cells in vitro after exposure to various concentrations of OA for 24, 48, and 72 h. Values are presented as means, and vertical bars indicate SEM (n = 6).
Notes: *p < 0.05 in comparison with control. ♦p < 0.05 in comparison with 24 and 48 h.
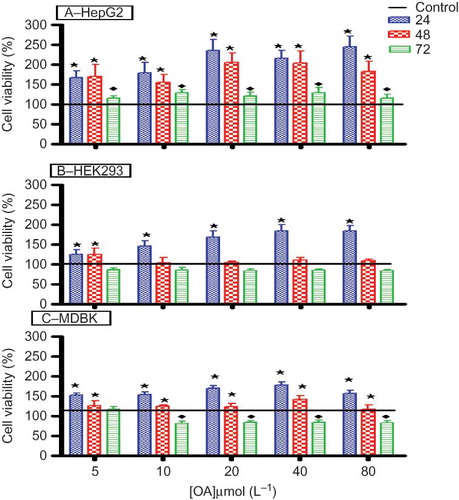
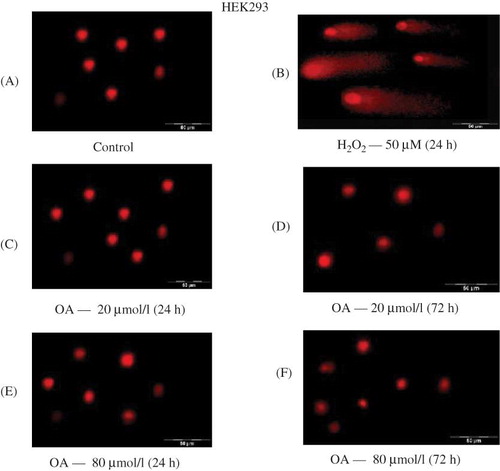
Figure 5. The effects of OA on DNA integrity of HEK293 cells in vitro after exposure to various concentrations of OA for 24 and 72 h. Control for 24 h (A), H2O2 — 50 μmol L−1 for 24 h (B), OA — 20 μmol L−1 for 24 h (C) and 72 h (D), and 80 μmol L−1 for 24 h (E) and 72 h (F).