Figures & data
Figure 1. (A) and (B) The serum levels of BUN and Cr in male and female animals, respectively, treated with losartan + CP, CP (positive control group), and saline (negative control group). (C) The percentage weight changes in male and female animals, respectively. The percentage weight change was calculated as [(last day weight – weight on the CP injection day)/weight on the CP injection day] × 100. The asterisk (*) indicates significant difference (p < 0.05) when compared with the negative control group. The sign (#) indicates significant difference (p < 0.05) when compared with the positive control group.
![Figure 1. (A) and (B) The serum levels of BUN and Cr in male and female animals, respectively, treated with losartan + CP, CP (positive control group), and saline (negative control group). (C) The percentage weight changes in male and female animals, respectively. The percentage weight change was calculated as [(last day weight – weight on the CP injection day)/weight on the CP injection day] × 100. The asterisk (*) indicates significant difference (p < 0.05) when compared with the negative control group. The sign (#) indicates significant difference (p < 0.05) when compared with the positive control group.](/cms/asset/ef2b34cd-ca73-43bf-b281-3a5122f8f37f/irnf_a_700886_f0001_b.jpg)
Table 1. The serum levels of Mg, TP, and nitrite in both genders.
Figure 2. (A) and (B) Total kidney weight/100 g of body weight values and KTDSs in male and female animals, respectively, treated with losartan + CP, CP (positive control group), and saline (negative control group). The asterisk (*) indicates significant difference (p < 0.05) in comparison with the negative control group. The sign (#) indicates significant difference (p < 0.05) in comparison with the positive control group. (C) Correlations between total kidney weight/100 g of body weight and KTDS in male and female animals, respectively. Significant correlations (p < 0.05) were observed between KTDS and kidney weight in both genders.
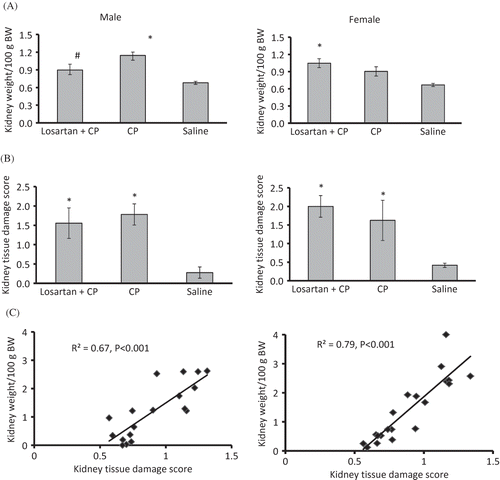
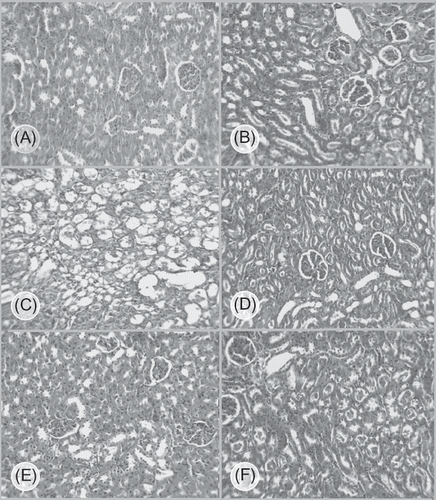
Figure 3. The images (magnification × 100) of the kidney tissue. (A) group 1: male, losartan + CP; (B) group 2: female, losartan + CP; (C) group 3: male, CP; (D) group 4: female, CP; (E) group 5: male, saline; and (F) group 6: female, saline. More tissue damage was observed in female losartan + CP and male CP-treated groups.