Figures & data
Table 1. The serum values of SCr, BUN, ALT, and AST.
Table 2. Immunohistochemical distribution of caspase-3 in the kidney tissue sections in all groups.
Figure 1. Histomorphology of kidneys. Light photomicrographs of PAS-stained sections of kidney from control rats and ischemic kidney from rats treated with Mel and VD3. (A) Control group, (B) focal loss of epithelial brush border lining of tubular cells (arrow) in the I/R group, (C) Mel + I/R group, (D) VD3 + I/R group, and (E) Mel + VD3 + I/R group. Bar = 20 μm. Asterisk denotes glomeruli.
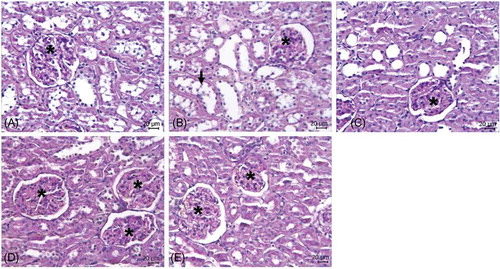
Figure 2. Immunoreactivity of caspase-3. (A) Control group, (B) I/R group, (C) Mel + I/R group, (D) VD3 + I/R group, and (E) Mel + VD3 + I/R group. Bar = 20 μm.
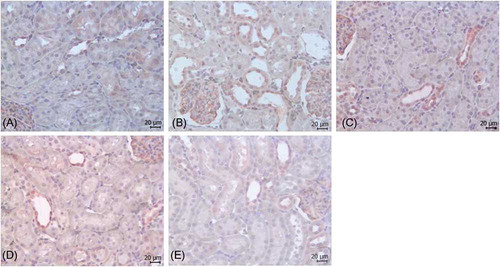
Figure 3. Effects of Mel and VD3 treatment on apoptosis induced by renal I/R. Apoptosis was evaluated by TUNEL staining (Brown nuclei). (A) Control group, (B) I/R group, (C) Mel + I/R, (D) VD3 + I/R, and (E) Mel + VD + I/R group. Bar = 20 μm.
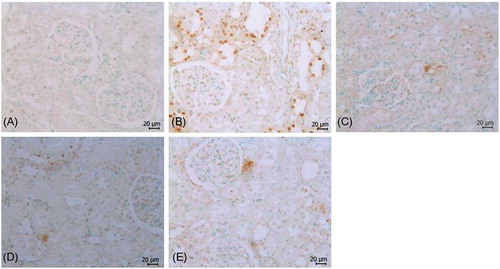
Figure 4. Percentage of TUNEL-positive cells in kidney sections.
Notes: The values are expressed as mean ± SEM. ap < 0.001 versus control group; bp < 0.001 versus I/R group; cp < 0.01 versus Mel + I/R, VD3 + I/R groups.