Figures & data
Figure 1. Distribution of low albumin concentrations among BMI values (N = 19).Note: A, area of low values; B, area of normal values; C, area of high values of the reference variable; D, areas of low values of the examining variable.
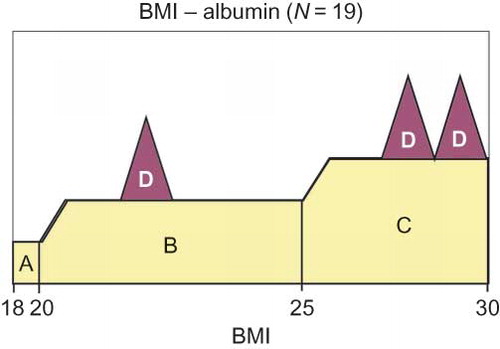
Figure 2. Distribution of low albumin concentrations among BMI values, (N = 89). Note: A, area of low values; B, area of normal values; C, area of high values of the reference variable; D, areas of low values of the examining variable.
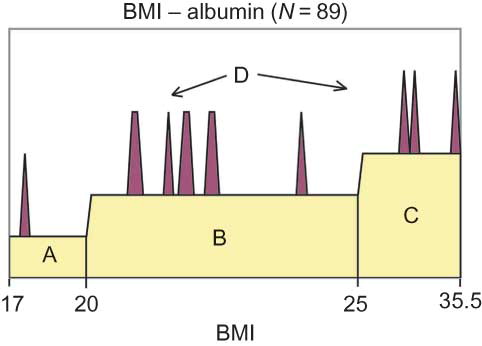
Table 1. Original values of BMI and albumin.
Figure 3. Distribution of low URR among Kt/V values.Note: Normal values of URR <65%; A, area of low values; B, area of normal values; C, area of high values of the reference variable; D, areas of low values of the examining variable.
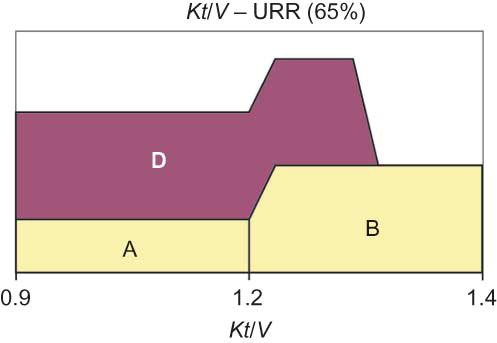
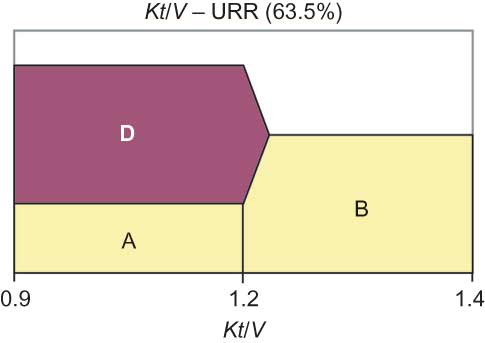
Figure 4. Distribution of low URR among Kt/V values.Note: Normal values of URR <63.5%; A, area of low values; B, area of normal values; C, area of high values of the reference variable; D, areas of low values of the examining variable.