Figures & data
Table 1. Oxidant and antioxidant parameters in rat groups (mean ± standard deviation).
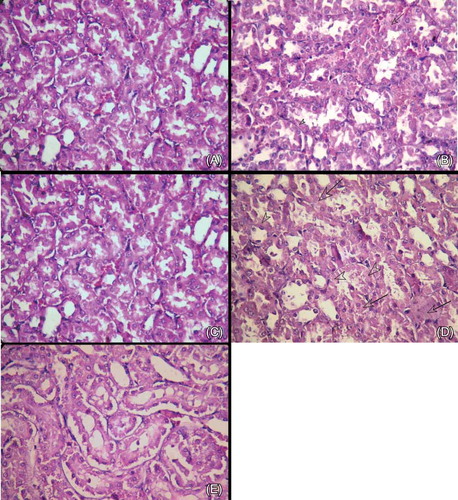
Figure 1. (A) Control group. Renal tubular structures (H&E, ×400). (B) ASA 50 mg group. Moderate cell swelling (arrow), some nuclear loss (arrowhead), and degenerative changes in tubular structures (H&E, ×400). (C) ASA 50 mg + CAPE group. Mild tubular cell swelling, some nuclear loss, and minimal degenerative changes in the tubules (H&E, ×400). (D) ASA 100 mg group. Prominent degenerative changes with cell swelling (arrows), much nuclear loss (arrowheads), nuclear pyknosis in the tubular cells, and moderate architectural impairment in the tubular structures (H&E, ×400). (E). ASA 100 mg + CAPE group. Improvement in the tubular structures, reduction of nuclear loss, and minimal cellular swelling compared with the ASA 100 mg group (Figure 1D) (H&E, ×400).