Figures & data
Table 1. Effects of infliximab on MDA, MPO, GSH and SOD levels in rats exposed to renal I/R.
Table 2. The comparison of severity of renal damage among groups.
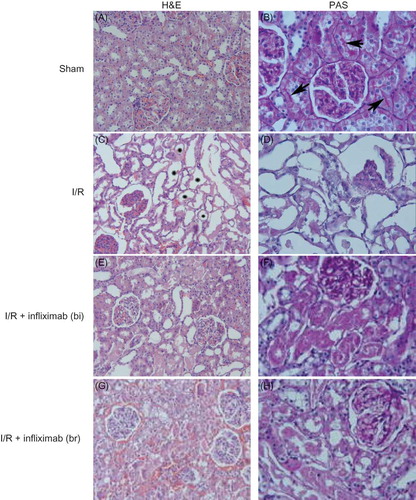
Figure 1. (A) Sham; renal tubules and glomeruli are intact. H&E ×66. (B) Sham; appearance of brush border (arrows). PAS ×132. (C) I/R group; tubules show diffuse and marked necrosis (*). H&E ×66. (D) I/R group; notice lost of the brush border and glomerular changes. PAS ×132. (E) I/R + infliximab (bi); despite tubular degeneration are visible in some area, glomeruli are seen intact. H&E ×66. (F) I/R + infliximab (bi); the loss of brush border was marked in affected tubules. PAS ×132. (G) I/R+ infliximab (br); moderate tubular damage and interstitial congestion are observed. H&E ×66. (H) I/R+ infliximab (br); the view of brush border is similar to ischemia group. PAS ×132.