Figures & data
Figure 1. Effects of radon (A) and α-tocopherol (B) on renal function-associated parameters in the serum of CCl4-administrated mice. Each value indicates the mean ± 95% confidence intervals. The number of mice per experimental point is—six to eight.
Note: *p < 0.05 versus CCl4, ###p < 0.01 versus control.
Figure 2. Effects of radon (A) and α-tocopherol (B) on oxidative damage-associated parameters in the kidney of CCl4-administrated mice. Each value indicates the mean ± 95% confidence intervals. The number of mice per experimental point is—five to seven.
Note: *p < 0.05, **p < 0.01 versus CCl4, ###p < 0.001 versus control.
Figure 3. Effect of radon (H) and α-tocopherol (I) on CCl4-induced renal damage in mouse: (A) control, (B) CCl4, (C) α-tocopherol 100 mg/kg + CCl4, (D) α-tocopherol 300 mg/kg + CCl4, (E) α-tocopherol 500 mg/kg + CCl4, (F) radon 1000 Bq/m3 + CCl4, (G) radon 2000 Bq/m3 + CCl4. Mouse kidneys were examined histologically. The length of the scale bar is 100 μm. All samples were stained with H&E. The arrow indicates dilatation of Bowman’s space with glomerular atrophy. Each value indicates the mean ± 95% confidence intervals. The number of mice per experimental point was—five to six.
Note: *p < 0.05, **p < 0.01 versus CCl4, ###p < 0.001 versus control.
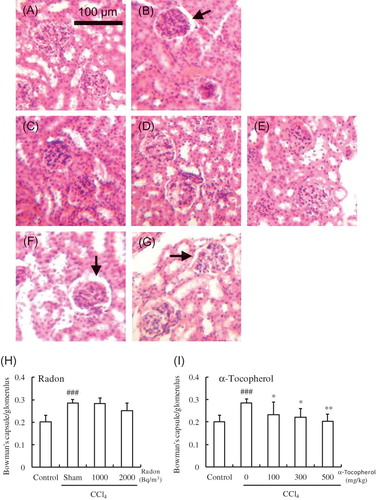
Figure 4. Effects of radon (A) and α-tocopherol (B) on antioxidative-associated parameters in the kidney of CCl4-administrated mice. Each value indicates the mean ± 95% confidence intervals. The number of mice per experimental point is—six to eight.
Note: *p < 0.05, **p < 0.01, ***p < 0.001 versus CCl4, ##p < 0.01, ###p < 0.001 versus control.