Figures & data
Figure 1. Effect of pirfenidone on TGF-β1-induced mRNA expression of PAI-1 (A), fibronectin (B), type I collagen α1 (C), CTGF (D), α-SMA (E), and vimentin (F) in NRK52E cells. Cells were treated with TGF-β1 (3 ng/mL) for 24 h with or without pirfenidone (0.1–1 mmol/L). Values are mean ± standard error of four independent experiments. *p < 0.05 versus vehicle group; **p < 0.05 versus TGF-β1-treated group.
Figure 2. Effect of pirfenidone on TGF-β1-induced PAI-1 production in NRK52E cells. Cells were treated with TGF-β1 (3 ng/mL) for 48 h with or without pirfenidone (0.1–1 mmol/L). Values are mean ± standard error of four independent experiments. *p < 0.05 versus vehicle group; **p < 0.05 versus TGF-β1-treated group.
Figure 3. (A) Effect of pirfenidone on TGF-β1-induced phosphorylation of signal kinase in NRK52E cells. Cells were treated with TGF-β1 (3 ng/mL) for 1 h with or without pirfenidone. (B) Time-course effect of pirfenidone and U0126 on TGF-β1-induced phosphorylation of ERK1/2 in NRK52E cells. Cells were treated with TGF-β1 (3 ng/mL) for various durations (5–120 min) with or without pirfenidone (0.5 mmol/L) or U0126 (1 μmol/L). Western blot images were quantified densitometrically. N, nontreatment; T, TGF-β1; P, TGF-β1 + pirfenidone; U, TGF-β1 + U0126.
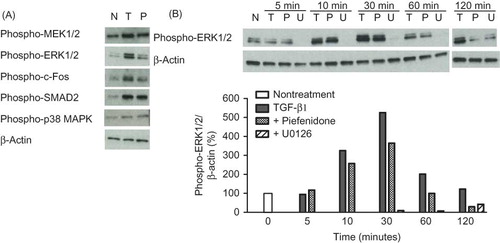
Figure 4. Effect of pirfenidone on TGF-β1- and PDGF-BB-induced mRNA expression of PAI-1 (A), fibronectin (B), type I collagen α1 (C), CTGF (D), and α-SMA (E) in NRK52E cells. Cells were treated with either TGF-β1 (3 ng/mL) or PDGF-BB or both (5 ng/mL) for 24 h with or without pirfenidone (0.5 mmol/L). Values are mean ± standard error of four independent experiments. *p < 0.05 versus vehicle group; **p < 0.05 versus TGF-β1-treated group; ***p < 0.05 versus TGF-β1, PDGF-BB, or TGF-β1 + PDGF-BB-treated group.
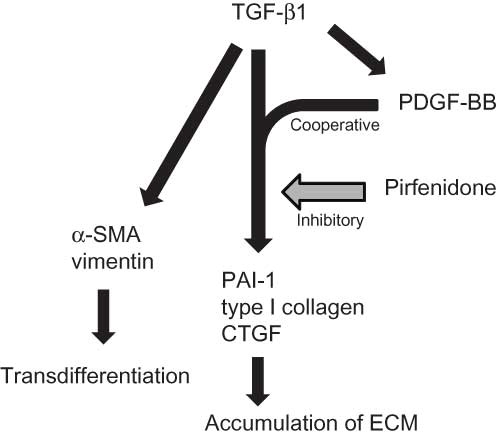
Figure 5. Pathogenetic pathways of renal fibrosis induced by TGF-β1 cooperative with PDGF and action point of pirfenidone indicated by the present results in cell-based assays.