Figures & data
Table 1. The demographic, clinical, and laboratory features of the healthy subjects and Rtx, HD, and PD patients.
Figure 1. NLR values of healthy subjects and Rtx, PD, and HD patients. NLR, neutrophil-to-lymphocyte ratio; Rtx, renal transplant; PD, peritoneal dialysis; HD, hemodialysis.
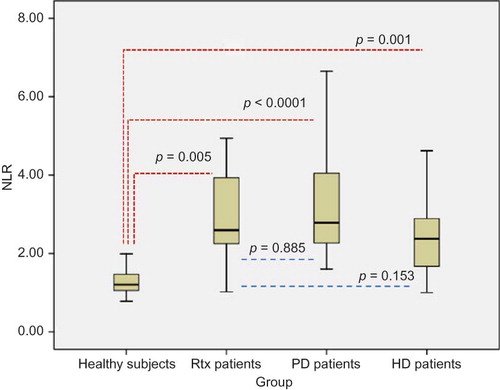
Figure 2. CIMT of healthy subjects and Rtx, PD, and HD patients. CIMT, carotid intima–media thickness; Rtx, renal transplant; PD, peritoneal dialysis; HD, hemodialysis.
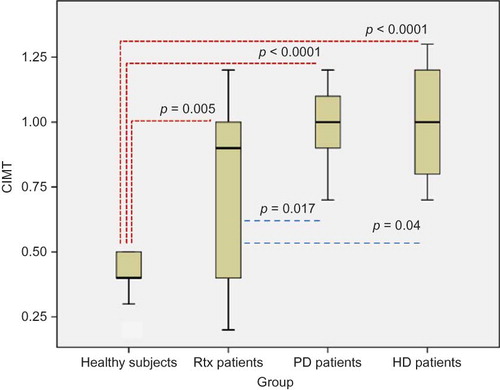
Figure 3. PTX-3 values of healthy subjects and Rtx, PD, and HD patients. PTX-3, pentraxin-3; Rtx, renal transplant; PD, peritoneal dialysis; HD, hemodialysis.
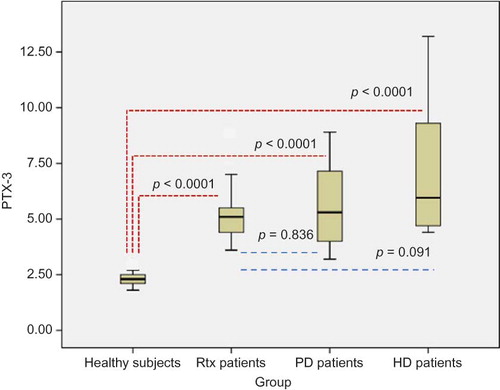
Figure 4. IMA values of healthy subjects and Rtx, PD, and HD patients. IMA, ischemia-modified albumin; Rtx, renal transplant; PD, peritoneal dialysis; HD, hemodialysis.
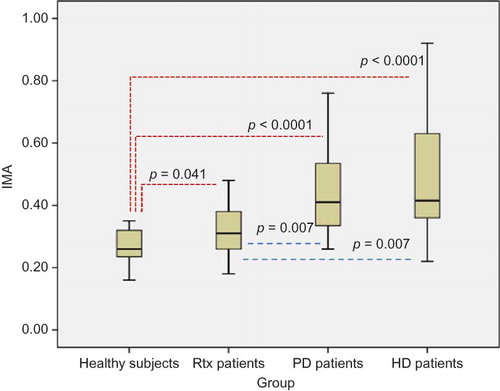
Table 2. Univariate correlations of IMA, CIMT, and PTX-3 with continuous variables.