1,303
Views
17
CrossRef citations to date
0
Altmetric
Laboratory Study

Losartan Alleviates Renal Fibrosis by Down-Regulating HIF-1α and Up-Regulating MMP-9/TIMP-1 in Rats with 5/6 Nephrectomy

, , , , , , & show all
Pages 1297-1304 | Received 14 May 2012, Accepted 14 Aug 2012, Published online: 24 Sep 2012

Figures & data

Figure 1. Differences of urine protein and NAG enzyme between different groups.

Note: Compared with sham group, 24-h urinary protein and urinary NAG levels in model group were significantly increased (p < 0.05), but losartan reduced urine protein and NAG levels (p < 0.05).

Figure 1. Differences of urine protein and NAG enzyme between different groups.Note: Compared with sham group, 24-h urinary protein and urinary NAG levels in model group were significantly increased (p < 0.05), but losartan reduced urine protein and NAG levels (p < 0.05).

Table 1. Cys-C (mg/L) levels in different groups .

Table 2. BUN and Scr levels in different groups .

Figure 2. Histopathological changes in rat renal tissue samples at 12th week (HE, Hematoxylin–eosin staining ×200; Masson, Masson staining ×200; EM, electron microscopy ×5000); (A) There was no significant histological abnormality in the sham group (HE); (B) glomerular sclerosis, renal tubular epithelial cell degeneration and necrosis, partial tubular atrophy, and some degree of interstitial fibrosis could be seen (HE); (C) in the losartan group, only local mild glomerular and tubular epithelial lesions were observed (HE); (D) there was no fibrosis of the interstitium in the sham group (Masson); (E) glomerular sclerosis with moderate fibrosis of the interstitium was seen in the model group (Masson); (F) a less severe renal fibrosis was observed in the losartan group (Masson); (G) the ultrastructure of intact glomerulus was seen in the sham group (EM); (H) an bending and thickening of the glomerular basement membrane, and podocytes swelling with fusion and flattening of part of the foot processes were found in the model group (EM); (I) less severe damages of the glomerular basement membrane and podocytes were observed in the losartan group (EM); (J) the normal tubule epithelial cells and basement membrane were seen in the control group (EM); (K) in the model group, tubular swelling and degeneration were found with significant interstitial fibroblast proliferation (EM); (L) a Less severe tubulointerstitial damage was observed in the losartan group (EM). Sham: sham-operation group, M: model group, L: losartan group.

Figure 2. Histopathological changes in rat renal tissue samples at 12th week (HE, Hematoxylin–eosin staining ×200; Masson, Masson staining ×200; EM, electron microscopy ×5000); (A) There was no significant histological abnormality in the sham group (HE); (B) glomerular sclerosis, renal tubular epithelial cell degeneration and necrosis, partial tubular atrophy, and some degree of interstitial fibrosis could be seen (HE); (C) in the losartan group, only local mild glomerular and tubular epithelial lesions were observed (HE); (D) there was no fibrosis of the interstitium in the sham group (Masson); (E) glomerular sclerosis with moderate fibrosis of the interstitium was seen in the model group (Masson); (F) a less severe renal fibrosis was observed in the losartan group (Masson); (G) the ultrastructure of intact glomerulus was seen in the sham group (EM); (H) an bending and thickening of the glomerular basement membrane, and podocytes swelling with fusion and flattening of part of the foot processes were found in the model group (EM); (I) less severe damages of the glomerular basement membrane and podocytes were observed in the losartan group (EM); (J) the normal tubule epithelial cells and basement membrane were seen in the control group (EM); (K) in the model group, tubular swelling and degeneration were found with significant interstitial fibroblast proliferation (EM); (L) a Less severe tubulointerstitial damage was observed in the losartan group (EM). Sham: sham-operation group, M: model group, L: losartan group.

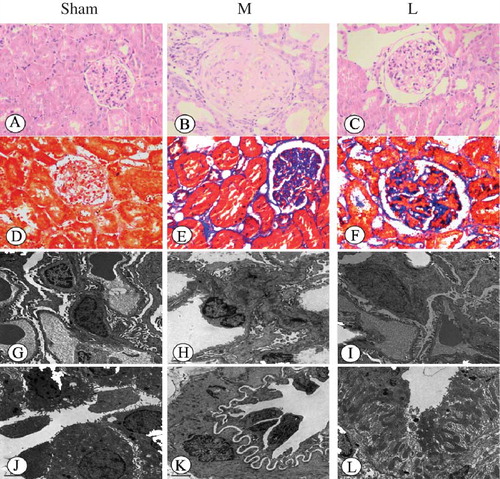
Table 3. Comparison of pathological score of rat kidneys .

Figure 3. The expressions of HIF-1α, TGF-β1, MMP-9, and TIMP-1 in rat renal tissues at 12th week (immunochemistry ×200). (1) In sham group, there was a very little expression of HIF-1α in the tubulointerstitial tissues, but abundant expression in tubular tissues in the model group. After losartan treatment, HIF-1α level in renal tissue was lower than in model group (p < 0.05). (2) A tracing tubulointerstitial expression of TGF-β1 was found in the sham group, whereas the expression in the model group increased significantly. Losartan treatment led to significantly decreasing TGF-β1 expression (p < 0.05). (3) Thimbleful glomerular expression of MMP-9 was detected in the sham group, while expression increased in the model group, and losartan treatment further increased significantly glomerular MMP-9 expression (p < 0.05). (4) A very small amount of renal expression of TIMP-1 was detected in the sham group, while expression increased in the model group, and losartan treatment decreased significantly renal TIMP-1 expression (p < 0.05). Sham: sham-operation group, M: model group, L:losartan group.

Figure 3. The expressions of HIF-1α, TGF-β1, MMP-9, and TIMP-1 in rat renal tissues at 12th week (immunochemistry ×200). (1) In sham group, there was a very little expression of HIF-1α in the tubulointerstitial tissues, but abundant expression in tubular tissues in the model group. After losartan treatment, HIF-1α level in renal tissue was lower than in model group (p < 0.05). (2) A tracing tubulointerstitial expression of TGF-β1 was found in the sham group, whereas the expression in the model group increased significantly. Losartan treatment led to significantly decreasing TGF-β1 expression (p < 0.05). (3) Thimbleful glomerular expression of MMP-9 was detected in the sham group, while expression increased in the model group, and losartan treatment further increased significantly glomerular MMP-9 expression (p < 0.05). (4) A very small amount of renal expression of TIMP-1 was detected in the sham group, while expression increased in the model group, and losartan treatment decreased significantly renal TIMP-1 expression (p < 0.05). Sham: sham-operation group, M: model group, L:losartan group.

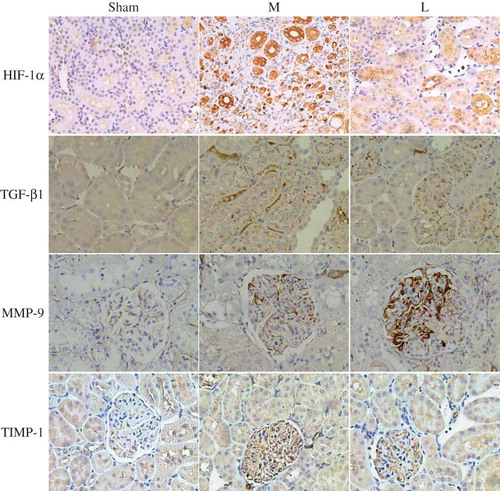
Table 4. Renal expression of HIF-1α, TGF-β1, MMP-9, and TIMP-1 in different groups .

Figure 4. The difference of HIF-1α (A), TGF-β1 (B), MMP-9 (C), and TIMP-1 (D) protein expressions in rat renal tissues at 12 weeks between different groups. Sham: sham-operation group, M: model group, L: losartan group.

Notes: The expressions of HIF-1α, TGF-β1, MMP-9, and TIMP-1 in the model group were higher than those in the sham group (p < 0.05), losartan treatment induced a decrease in HIF-1α, TIMP-1, and TGF-β1 and an increase in MMP-9 (p < 0.05). #p < 0.05 versus sham-operation group, *p < 0.05 versus model group.

Figure 4. The difference of HIF-1α (A), TGF-β1 (B), MMP-9 (C), and TIMP-1 (D) protein expressions in rat renal tissues at 12 weeks between different groups. Sham: sham-operation group, M: model group, L: losartan group.Notes: The expressions of HIF-1α, TGF-β1, MMP-9, and TIMP-1 in the model group were higher than those in the sham group (p < 0.05), losartan treatment induced a decrease in HIF-1α, TIMP-1, and TGF-β1 and an increase in MMP-9 (p < 0.05). #p < 0.05 versus sham-operation group, *p < 0.05 versus model group.

Reprints and Corporate Permissions

Please note: Selecting permissions does not provide access to the full text of the article, please see our help page How do I view content?

To request a reprint or corporate permissions for this article, please click on the relevant link below:

Academic Permissions

Please note: Selecting permissions does not provide access to the full text of the article, please see our help page How do I view content?

Obtain permissions instantly via Rightslink by clicking on the button below:

If you are unable to obtain permissions via Rightslink, please complete and submit this Permissions form. For more information, please visit our Permissions help page.