Figures & data
Table 1. Effects of GEN alone and its combination with PE on plasma urea, creatinine, Na+, K+, and 24-h urine volume levels in rats.
Table 2. Effects of PE on NO, MDA, and GSH levels of rat kidney.
Figure 1. (A) Normal tubules and glomeruli in kidney cortex, staining with H&E ×100 (control group). (B) Severe tubular necrosis, tubular degeneration, and epithelial vacuolization in the proximal tubules, staining with H&E ×100 (GEN-treated group). (C) Moderate tubular necrosis, tubular degeneration, and epithelial vacuolization in the proximal tubules, staining with H&E ×100 (GEN + vehicle-treated group). (D) Mild epithelial vacuolization in the proximal tubules and normal glomeruli, staining with H&E ×100 (GEN + PE-treated group).
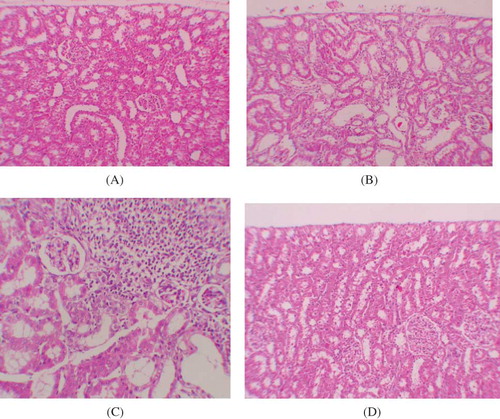
Figure 2. (A) No fibrosis in the control group, staining with Masson’s trichrome ×100. (B) Mild fibrosis in interstitium, staining with Masson’s trichrome ×400 (GEN-treated group). (C) Mild fibrosis in interstitium, staining with Masson’s trichrome ×200 (GEN + vehicle-treated group). (D) No fibrosis in GEN + PE-treated group, staining with Masson’s trichrome ×100.
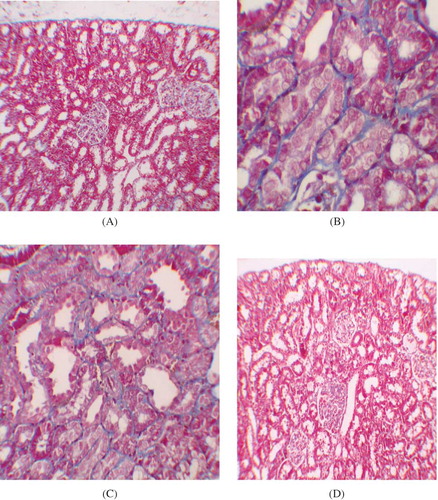
Table 3. Semiquantitative analysis of tubular necrosis, tubular vacuolization, parietal cell hyperplasia in the control, GEN-, GEN + vehicle-, and GEN + PE-treated rats.
Table 4. Analysis of kidney fibrosis in the control, GEN-, GEN + vehicle-, and GEN + PE-treated rats.