1,001
Views
14
CrossRef citations to date
0
Altmetric
Clinical Study

Clinical Characteristics and Treatment of Patients with IgA Nephropathy and Hepatitis B Surface Antigen

, , , , , , , & show all
Pages 446-451 | Received 29 Oct 2012, Accepted 01 Feb 2013, Published online: 18 Mar 2013

Figures & data

Figure 1.  Comparison of histology based on WHO classification between idiopathic IgAN and HBV-IgAN. There was no difference in histology between two the groups.

Figure 1.  Comparison of histology based on WHO classification between idiopathic IgAN and HBV-IgAN. There was no difference in histology between two the groups.

Figure 2.  Immunohistochemical staining for HBsAg. Nine tissues were not stained by HBsAg as like A, one case (B) was stained by anti-HBsAg in the cytoplasm of tubular cells.

Figure 2.  Immunohistochemical staining for HBsAg. Nine tissues were not stained by HBsAg as like A, one case (B) was stained by anti-HBsAg in the cytoplasm of tubular cells.

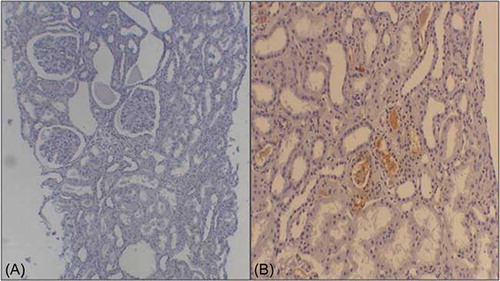
Table 1.  The clinical and laboratory findings of the 360 patients with HBs-IgAN.

Table 2.  Comparison of baseline characteristics between idiopathic IgAN and HBs-IgAN.

Figure 3.  (A) Comparison of renal survival between idiopathic IgAN and HBs-IgAN. There was no difference of renal survival between two groups. (B) Comparison of renal survival between three groups: a group with idiopathic IgAN, a group who had HBs-IgAN without HBVRM and a group had HBs-IgAN with HBV RM. There was no difference of renal survival between three groups.

Figure 3.  (A) Comparison of renal survival between idiopathic IgAN and HBs-IgAN. There was no difference of renal survival between two groups. (B) Comparison of renal survival between three groups: a group with idiopathic IgAN, a group who had HBs-IgAN without HBVRM and a group had HBs-IgAN with HBV RM. There was no difference of renal survival between three groups.

Table 3.  The clinical and laboratory findings of 9 patients with HBV RM.

Table 4.  Characteristics of patients with steroid therapy.

Figure 4.  (A) Comparison of eGFR between patients with anti-viral therapy and without. (B) Comparison of urinary protein excretion rate between patients with anti-viral therapy and without.

Figure 4.  (A) Comparison of eGFR between patients with anti-viral therapy and without. (B) Comparison of urinary protein excretion rate between patients with anti-viral therapy and without.

Reprints and Corporate Permissions

Please note: Selecting permissions does not provide access to the full text of the article, please see our help page How do I view content?

To request a reprint or corporate permissions for this article, please click on the relevant link below:

Academic Permissions

Please note: Selecting permissions does not provide access to the full text of the article, please see our help page How do I view content?

Obtain permissions instantly via Rightslink by clicking on the button below:

If you are unable to obtain permissions via Rightslink, please complete and submit this Permissions form. For more information, please visit our Permissions help page.