Figures & data
Figure 1. Survival curves of mice challenged with HgCl2 transplanted with BMMC. HgCl2-challenged mice (n = 10 per group) received saline or BMMC intravenously at different times after HgCl2 administration (3, 6, and 12 h; n = 8, on each group). Mortality was evaluated up to 10 days after challenge.Note: *p < 0.05, Kaplan–Meier log rank test.
Figure 2. Serum mercuric concentration before and after BMMC transplantation. Groups of mice were challenged with HgCl2. Serum mercuric concentrations were determined 0, 3, 6, and 12 h after challenge (p > 0.05; ANOVA, Turkey’s Multiple Comparison test). Values represent individual mice, n = 8–10 per group.
Figure 3. Serum concentrations of urea, creatinine, potassium, and sodium in HgCl2-challenged mice transplanted or not with BMMC. Groups of mice were challenged with HgCl2 and transplanted with BMMC 12 h later. Serum urea (p = 0.0409) and potassium levels were significantly diminished in treated animals after cell therapy, (p < 0.01; ANOVA, Newman–Keuls Multiple Comparison Test) (3B and C). The reduction on creatinine and sodium levels did not achieve significance (p > 0.05; ANOVA, Newman–Keuls Multiple Comparison Test) (3A and D). Values represent the means ± SEM of 5 mice/group.
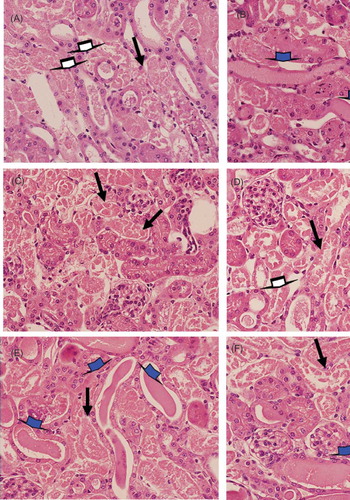
Figure 4. Histological analysis of kidney sections from HgCl2-injured mice treated (4B, D, and F) or not (4A, C, and E) with BMMC. Alterations in kidney morphology were observed 24 (4A and B), 48 (4C and D), and 72 h (4E and F) after HgCl2 injection. Magnifications 600×. Degeneration of tubular cells (black arrows), cellular debris (white arrows), and intratubular protein cylinder (blue arrows). Representative images of groups of mice euthanized at each time point (n = 5/group/time point).