Figures & data
Figure 1. Effects of FTY720 on systolic blood pressure in the subtotally nephrectomized rats. After the subtotal nephrectomy, blood pressure rose significantly in the SNX group compared with the sham group. Treatment with FTY720 did not attenuate these abnormalities. n = 8, *p < 0.01 versus sham.
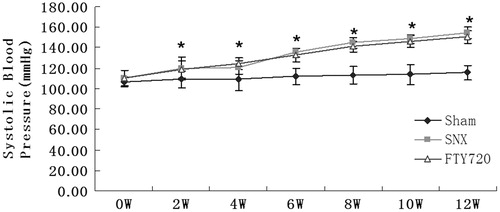
Table 1. Effect of FTY720 on basic data in 5/6 nephrectomized rats.
Figure 2. Effects of FTY720 on the number of peripheral white blood cells, lymphocytes and monocytes. The whole white blood cell count (A), blood lymphocyte count (B) and blood monocyte count (C) 12 weeks after the 5/6 nephrectomy. FTY720 significantly reduced the number of peripheral whole white blood cells and lymphocyte, but FTY720 did not reduce the number of peripheral monocytes. #p < 0.01 versus SNX.
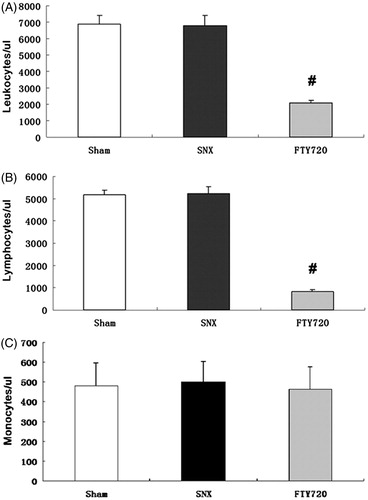
Figure 3. FTY720 attenuates the tubulointerstitial histological changes in the subtotally nephrectomized rats. Representative examples of PAS stains (A–C) and Masson stains (D, E) showing the tubulointerstitial histological changes (original magnification: ×200). Semiquantitative analyses of the tubulointerstitial inflammatory cells (G) and tubulointerstitial fibrosis (H). The tubulointerstitial fibrotic area and the number of inflammatory cells was markedly increased in the SNX animals compared with sham and was lower in SNX+FTY720 group; n = 8, *p < 0.01 versus sham, #p < 0.01 versus SNX.
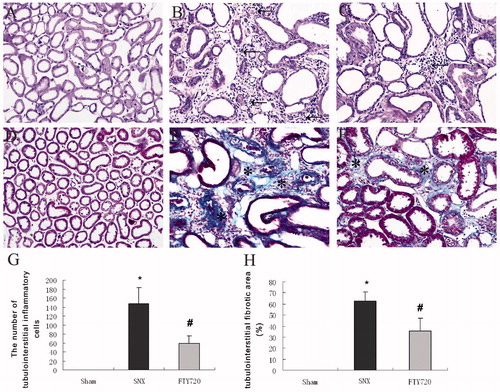
Figure 4. Effects of FTY720 on tubulointerstitial staining of T cells (CD3), T cell subtypes (CD4, CD8), B cells (CD20), macrophages (CD68) and macrophage subtypes (CCR7/M1, CD163/M2). FTY720 treatment significantly reduced the number of the interstitial infiltration of CD3-positive (A), CD4-positive (B), CD8-positive T cells (C), CD20-positive B cells (D), CD68-positive (E), CCR7-positive (F) and CD163-positive macrophages (G) in the SNX rats. Original magnification: ×400. Data are presented as the mean ± SD, n = 8, *p < 0.01 versus sham, #p < 0.01 versus SNX.
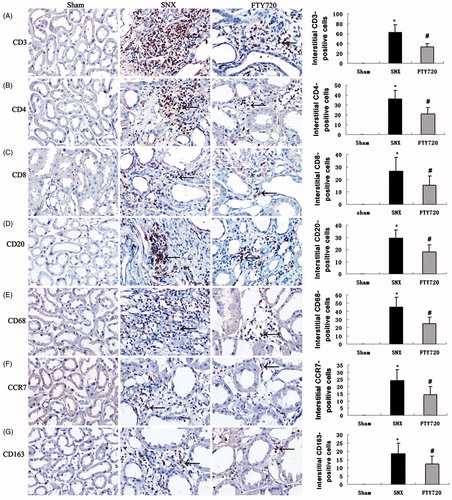
Figure 5. Effects of FTY720 on the expression of proinflammatory molecules. Representative western blotting analysis of IL-6, TNF-α and MCP-1 are shown for the sham, SNX and SNX+FTY720 groups (A). Densitometric results showed that FTY720 treatment prevented the upregulation of IL-6 (B), TNF-α (C) and MCP-1 (D). β-Actin was used as an internal control. Data are presented as the mean ± SD, n = 3, *p < 0.01 versus sham, #p < 0.01 versus SNX.
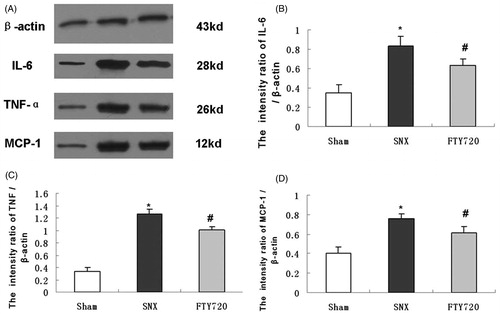
Figure 6. Effects of FTY720 on the expression of profibrotic molecules (TGF-β1). Representative tubulointerstitial immunostaining of TGF-β1 are shown for the sham (A), untreated SNX (B) and SNX+FTY720 groups (C). FTY720 treatment prevented the upregulation of TGF-β1 in the tubulointerstitial area (D). Original magnification: ×200. Data are presented as the mean ± SD, n = 8, *p < 0.01 versus sham, #p < 0.01 versus SNX.
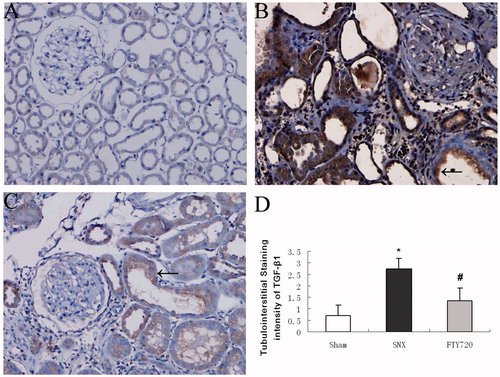
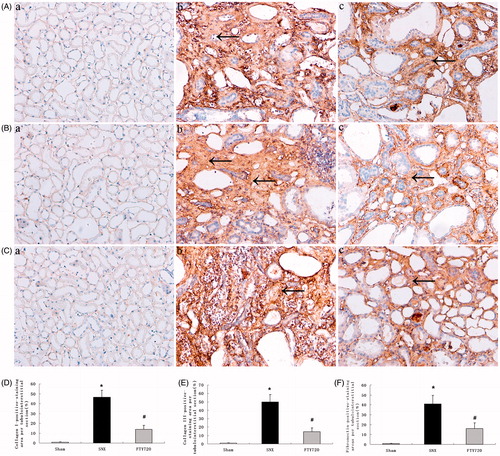
Figure 7. Effects of FTY720 on protein expression of collagens I, III and fibronectin. Representative tubulointerstitial immunostaining of collagens I (A), III (B) and fibronectin (C) are shown for the sham (a), untreated SNX (b) and FTY720-treated SNX groups (c). Original magnification: ×200. the positive-staining areas of collagens I, III and fibronectin are larger in the SNX rats than in the sham; FTY720 administration significantly reduced these abnormalities (D, E, F). Data are presented as the mean ± SD, n = 8, *p < 0.01 versus sham, #p < 0.01 versus SNX.