Figures & data
Table 1. Biological findings on admission in ICU.
Figure 1. Evolution of the incidence of acute renal failure during from 1995 to 2011 in our intensive care unit.
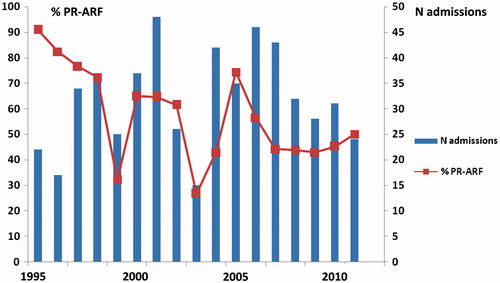
Figure 2. Creatinine levels in patients with acute pregnancy-related acute renal failure.
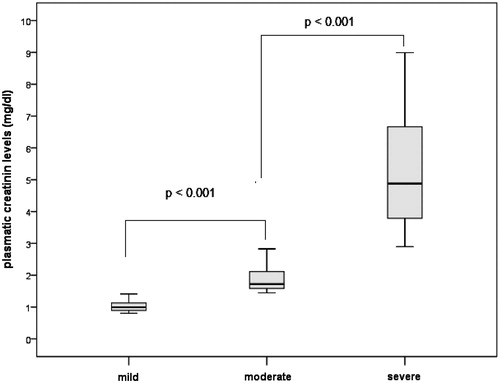
Table 2. Etiology of obstetric acute renal failure.
Table 3. Comparison of PRARF (+) and PRARF (−) according to demographic characteristics.
Table 4. Comparison of PRARF (+) and PRARF (−) according to biological findings on admission.
Figure 3. ROC curve showing the correlation between serum creatinine level and ICU mortality (area under curve = 0.761).
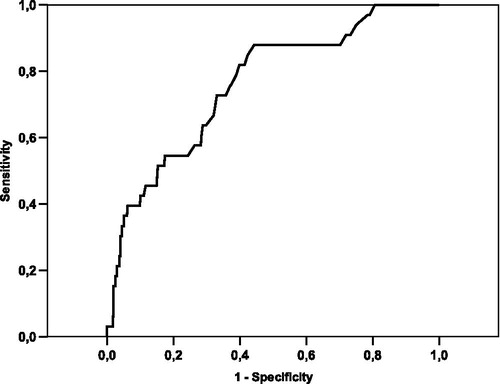
Table 5. Prognosis impact of PRARF.