Figures & data
Table 1. Baseline characteristics of study population grouped according to donor age.
Figure 1. Differences in postoperative eGFR by donor age difference. Data were expressed as means – SD for Group 1 and means + SD for Group 2. eGFR was significantly lower at all the eight time points in Group 1. eGFR: estimated glomerular filtration rate, measured by Cockcroft--Gault formulation.
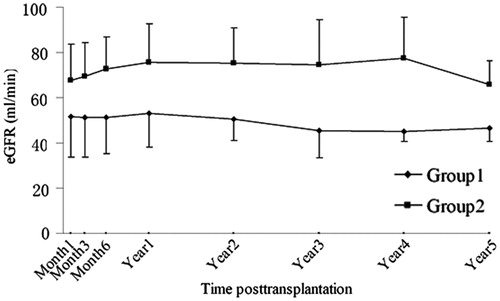
Table 2. Differences in postoperative creatinine by donor age difference (μmol/L).