Figures & data
Table 1. Effect of p-coumaric acid on serum kidney markers in cadmium chloride-intoxicated rats.
Table 2. Effect of p-coumaric acid on urinary kidney markers in cadmium chloride-intoxicated rats.
Table 3. Effect of p-coumaric acid on kidney lipid peroxidation levels and antioxidant status in cadmium chloride-intoxicated rats.
Table 4. Effect of p-coumaric acid on lysosomal enzymes in kidney of cadmium chloride-intoxicated rats.
Table 5. Effect of p-coumaric acid on glycoproteins in kidney of cadmium chloride-intoxicated rats.
Figure 1. Effect of p-coumaric acid on metallothionein concentration in kidney tissues of rats exposed to cadmium chloride. Group I – Control rats, Group II – Cadmium chloride-intoxicated rats, Group III – Cadmium chloride-intoxicated rats treated with p-coumaric acid (100 mg/kg b.wt) and Group IV – Cadmium chloride-intoxicated rats treated with Silymarin (50 mg/kg b.wt). Each value represents the mean ± SD of six rats. Comparisons were made as follows: aGroup I versus Group II, III and IV, bGroup II versus Group III and cGroup II versus Group IV. The symbols represent statistical significance at: *p < 0.05. Statistical analysis was calculated by one-way ANOVA followed by Student’s Newman–Keul’s test.
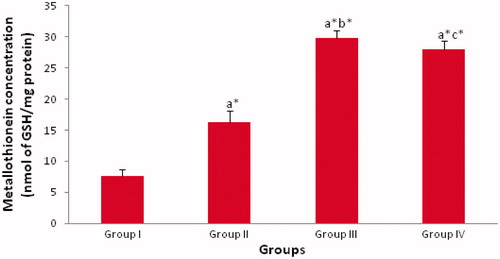
Figure 2. Effect of p-coumaric acid on cadmium concentration in kidney tissues of rats exposed to cadmium chloride. Group I – Control rats, Group II – Cadmium chloride-intoxicated rats, Group III – Cadmium chloride-intoxicated rats treated with p-coumaric acid (100 mg/kg b.wt) and Group IV – Cadmium chloride-intoxicated rats treated with Silymarin (50 mg/kg b.wt). Each value represents the mean ± SD of six rats. Comparisons were made as follows: aGroup I versus Group II, III and IV, bGroup II versus Group III and cGroup II versus Group IV. The symbols represent statistical significance at: *p < 0.05. Statistical analysis was calculated by one-way ANOVA followed by Student’s Newman–Keul’s test.
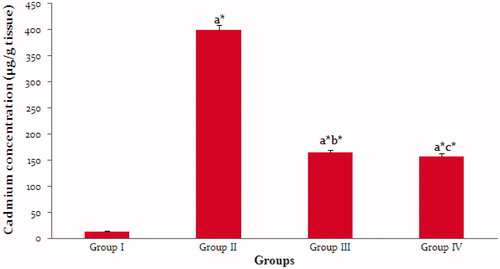
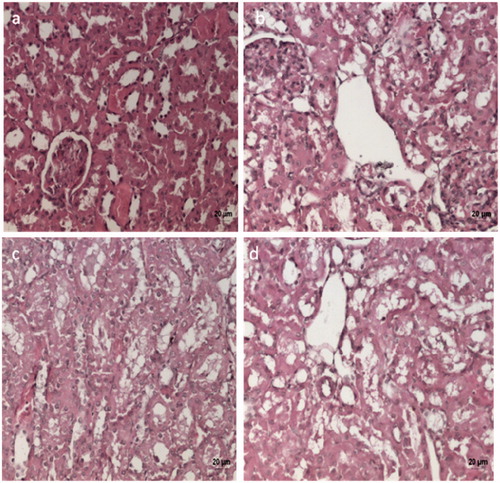
Figure 3. Histopathological analysis of the nephroprotective potential of p-coumaric acid in cadmium chloride-intoxicated rats (H&E 20X). (a) Control rats showing normal rat kidey – normal glomeruli and tubular structure. (b) Cadmium chloride-intoxicated rats showing severe kidney tubular epithelial cell degeneration. (c,d) Cadmium chloride followed by p-coumaric acid (100 mg/kg b.wt) and silymarin (50 mg/kg b.wt) treated rats, respectively, showing improvement over cadmium intoxicated group with mild tubular epithelial cell degeneration.