Figures & data
Table 1. Baseline characteristics of the study population.
Figure 1. Change in serum uric acid concentration (mean ± SD) before and after the start of febuxostat treatment (number in parentheses indicates number of patients). ***p < 0.001 versus Month 0 (paired t-test).
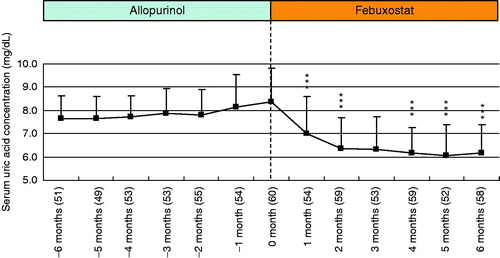
Figure 2. Change in serum uric acid concentrations (mean ± SD) during febuxostat treatment stratified by (a) gender and (b) baseline eGFR (mL/min/1.73 m2). ***p < 0.001 versus Month 0 (paired t-test).
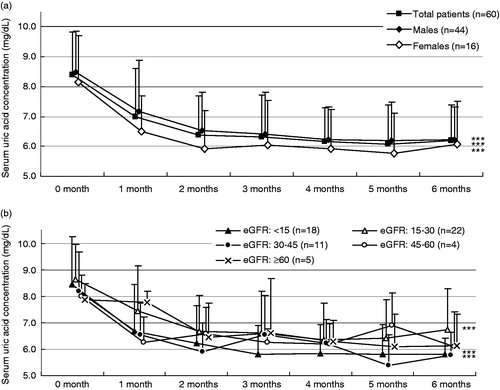
Figure 3. Change in eGFR (mean ± SD) before and after the start of febuxostat treatment in patients with a baseline eGFR <15 mL/min/1.73 m2 (number in parentheses indicates number of patients). *p < 0.05 versus Month 0 (paired t-test).
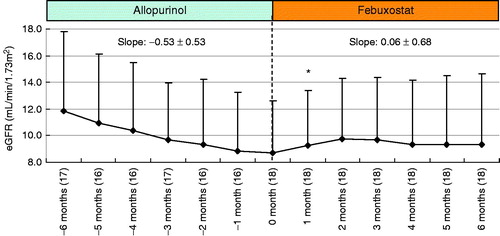
Table 2. Change from baseline in eGFR (mL/min/1.73 m2) after the start of febuxostat treatment.
Table 3. Correlation between the change in serum uric acid concentrations and change in eGFR at 6 months after the start of febuxostat treatment.
Figure 4. Change in eGFR slope (mean ± SD) before (a) and after (b) the start of febuxostat treatment (number in parentheses indicates number of patients). *p < 0.05 versus Month 0 (paired t-test).
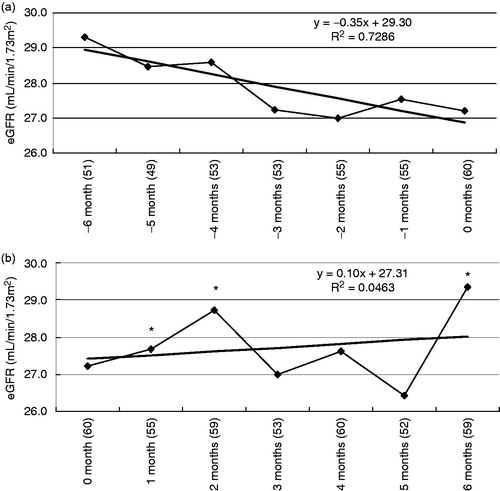
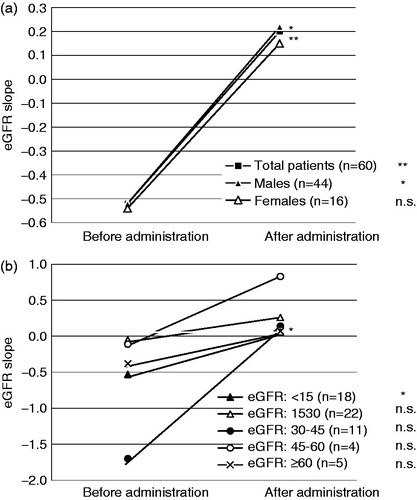
Figure 5. Change in eGFR slope (mean ± SD) before and after febuxostat treatment stratified by (a) gender and (b) baseline eGFR (mL/min/1.73 m2). *p < 0.05 and **p < 0.01 versus before treatment (paired t-test).