Figures & data
Table 1. General characteristics of the study population during basal conditions.
Figure 1. The relationship between salt intake and SBP.
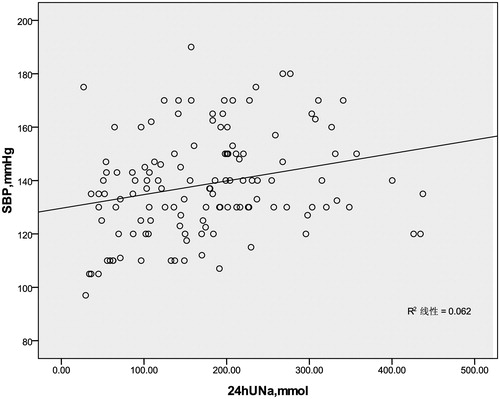
Table 2. The relationship of salt intake and blood pressure in different groups.
Figure 2. The regularity of SBP and dietary sodium intake with the change of eGFR.
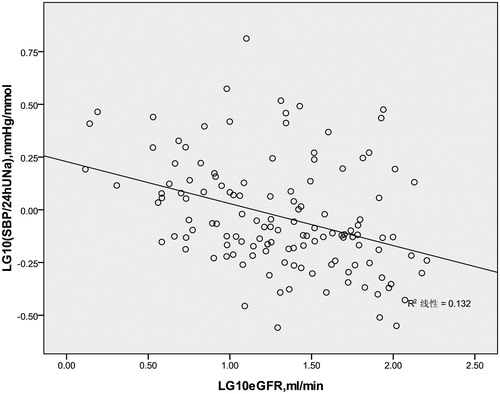
Figure 3. The regularity of DBP and dietary sodium intake with the change of eGFR.
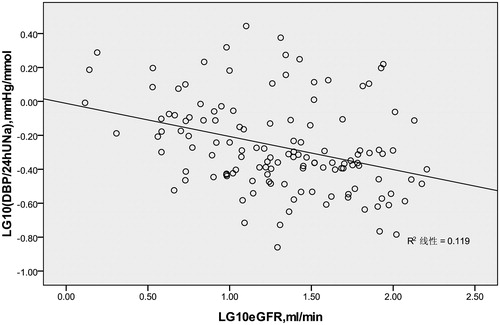
Table 3. Multivariate regression analysis of SBP and DBP. (Prior to stepwise analysis).
Table 4. Results of stepwise regression analysis with SBP and DBP as dependent variables.
Table 5. The relationship between the dosage of the antihypertensive drugs (DDD) and salt intake.
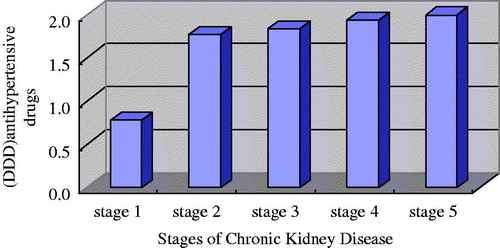
Figure 4. Compare of the dosage of the antihypertensive drugs in every stage of CKD.