Figures & data
Table 1. Characteristics of the study participants with and without late-stage CKDa.
Table 2. Comparisons of demographic characteristics on the exposure or non-exposure to analgesicsa.
Table 3. Multivariate logistic regression analysis for late-stage CKD.
Table 4. Multivariate linear regression analysis for late-stage CKD.
Figure 1. Relationship between percent of patients reporting use of analgesics and different education backgrounds. Symbol * indicates significant difference versus eGFR < 60 group, and symbol # indicates significant difference versus low degree of education group (p < 0.05).
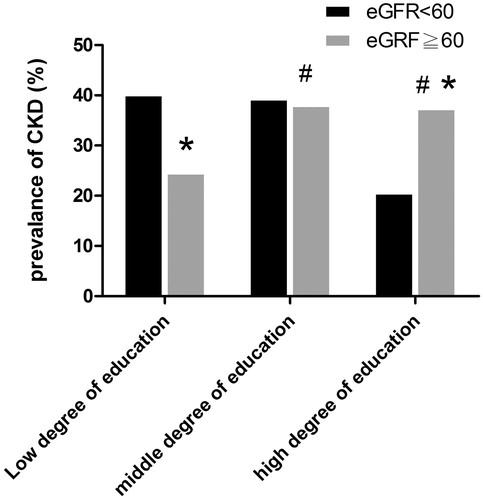
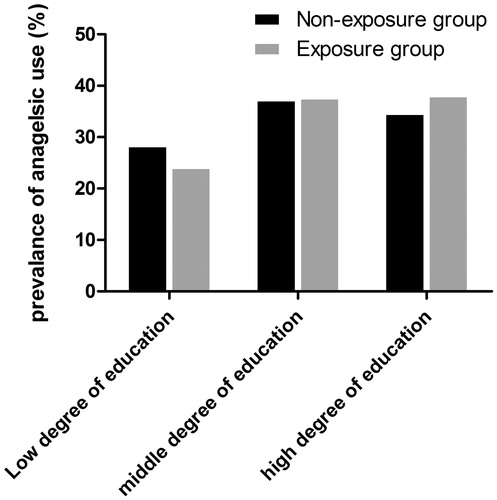
Figure 2. Relationship between percent of patient with chronic kidney disease and different education backgrounds. No significant difference vs. exposure group (p > 0.05).