Figures & data
Figure 1. Effect of Astragalosides IV (ASI) on high glucose-induced apoptosis in tubular epithelial cells. (A) ASI inhibited apoptosis in a concentration-dependent manner. (B) Time course of TUNEL fluorescence in different group. Data are expressed as the mean ± SEM of three independent experiments. *p < 0.05, compared with control group (CON). ▴p < 0.05, compared with high glucose group (HG).
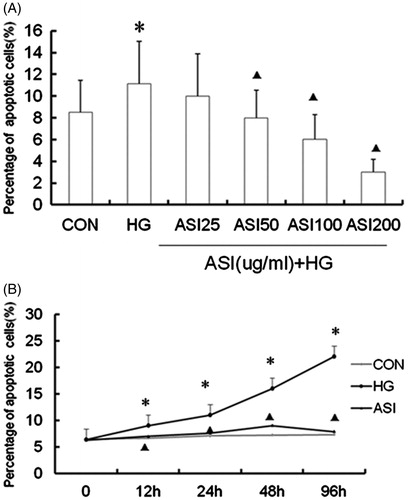
Figure 2. Effect of ASI on expression of HGF and TGF-β1 in tubular epithelial cells. (A) ASI inhibited the secretion of TGF-β1 protein in concentration-dependent manner. (B) ASI promoted the secretion of HGF protein in concentration-dependent manner. (C) ASI inhibited the secretion of TGF-β1 protein in time-dependent manner. (D) ASI promoted the secretion of HGF protein in time-dependent manner. Data are expressed as the mean ± SEM of three independent experiments. ▴p < 0.05, ▴▴p < 0.01 compared with high glucose groups (HG).
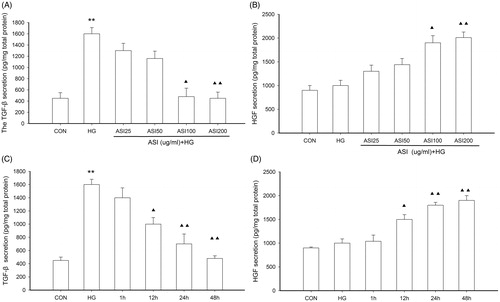
Figure 3. Effect of ASI on tubular epithelial cells viability. Cells were treated with ASI (25, 50, 100 and 200 μg/mL) or vehicle for 24 h. Cell viability was determined with the Cell Counting Kit-8. Each treatment group is triplicate. Data are expressed as mean ± SEM.
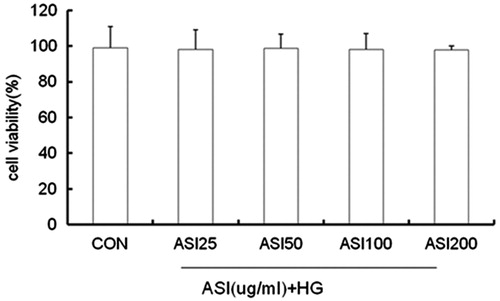
Figure 4. Effect of ASI on MAPK signaling pathway activation. (A) Bands of phospho-p38, phospho-ERK and phospho-JNK for the indicated concentration of ASI. (B) Semi-quantitative analysis of proteins showed that ASI inhibited the expression of phospho-p38 in concentration-dependent manner, but had no effect on the phospho-ERK and phospho-JNK. Each treatment group is triplicate. Data are expressed as the mean ± SEM. ▴p < 0.05, ▴▴p < 0.01 compared with high glucose groups (HG).
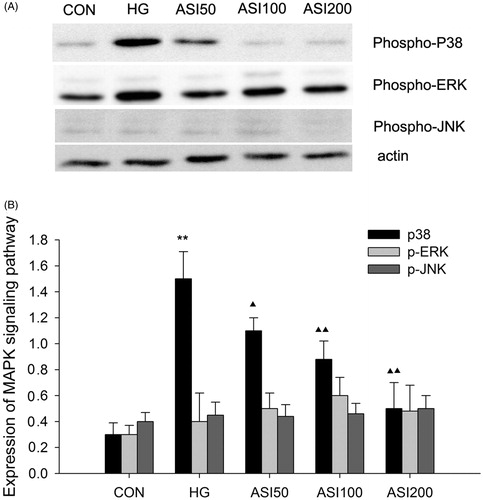
Figure 5. The inhibitory effect of ASI and phospho-p38 inhibitor SB202190 on cell apoptosis in tubular epithelial cells under high glucose conditions. The cell apoptosis were then analyzed by caspase 3 activity (A) and TUNEL (B). Data are expressed as the mean ± SEM of three independent experiments. **p < 0.01 compared with control group (CON), ▴p < 0.05, ▴▴p < 0.01 compared with high glucose groups (HG).
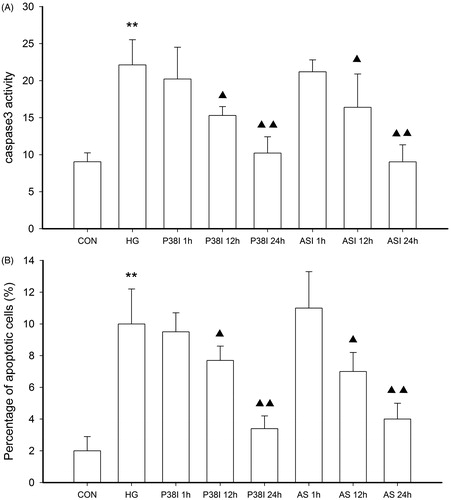
Figure 6. Effect of HGF on the expression of phospho-p38. (A) Bands of phospho-p38 for the different concentration of HGF. (B) Semi-quantitative analysis of proteins showed that HGF inhibited the expression of phospho-p38 in concentration-dependent manner. Data are expressed as the mean ± SEM of three independent experiments. **p < 0.01, compared with control group (CON). ▴p < 0.05, ▴▴p < 0.01 compared with high glucose groups (HG).
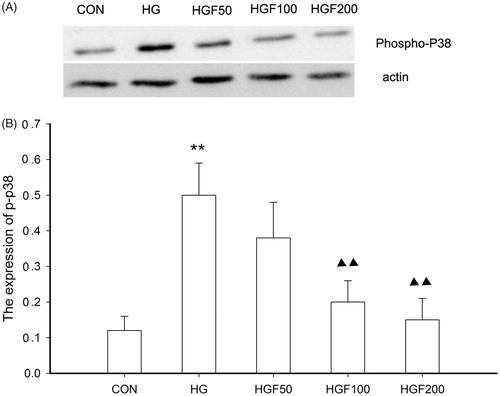
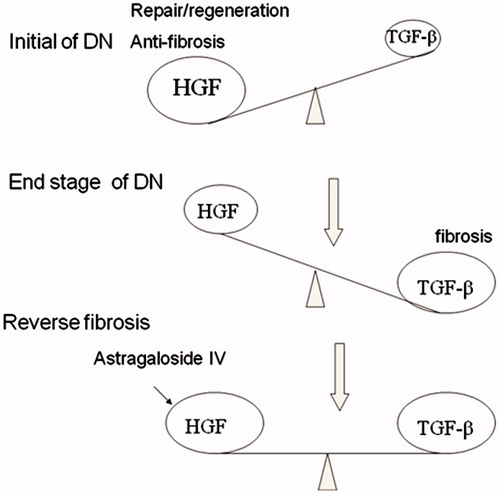
Figure 7. Therapeutic strategies for renal fibrosis. The duration of injury may determine whether the damaged tissues undergo recovery or fibrogenesis. The injury leads to a TGF-β1/HGF ratio that favors HGF, resulting in tissue repair and regeneration, whereas chronic injury dramatically changes the TGF-β1/ HGF ratio to favor TGF-β1, leading to tissue fibrosis. In the fibrotic kidney, the TGF-β1/HGF ratio is out of balance, and TGF-β1 signaling dominates. Thus, therapeutic strategies should include a reduction of TGF-β1 activity and/or supplementation of HGF. It is likely that ASI to influence the balance between TGF-β1 and HGF would be effective in ameliorating renal fibrosis.