Figures & data
Figure 1. Tolerance Induction Protocol paradigm: On day 0 and 24, immune monitoring was performed by lymphocyte cross-match (LCM), using CDCC cross-match, flow cross-match for T and B-cells and donor specific antibody (DSA) by single antigen assay using Luminexx solid phase assay. Peripheral blood stem cells collected from donor were infused in peripheral circulation of recipient after dialysis, on day 6 and stem cells generated from donor were infused in portal circulation by minilaparotomy. On days 13, 16, 19, and 22 Bortezomib, 1.3 mg/m2 was administered intravenously (IV) along with methylprednisone (MP), 250 mg after favorable immune monitoring with LCM, FCM, and SA. Induction was done by rabbit anti-thymocyte globulin, 1.5 mg/kg BW intraoperatively with MP, 500 mg IV on days −1, 0, +1, 250 mg on day +2 and 125 mg on day +3 after transplantation. Rituximab was administered on third post-operative day followed by Bort on day 28, 32, 36, and 41, respectively, with close monitoring for complete blood counts and platelet counts.
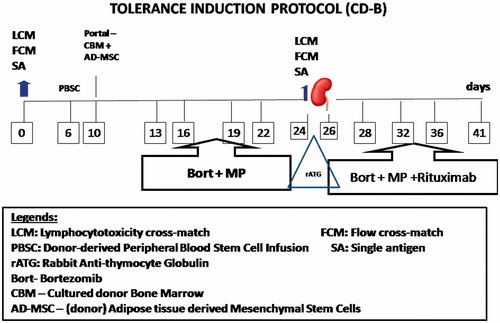
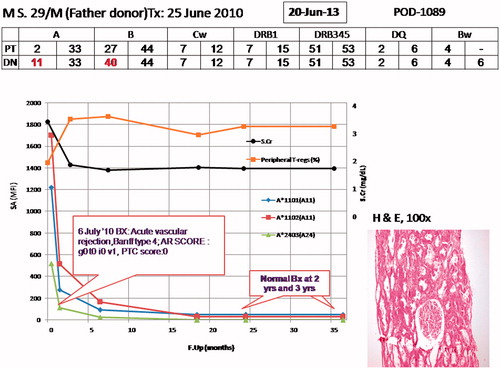
Figure 2. Graph showing the complete status of patient; on top is his age, initials, mentioning father as donor, and transplant date. On top in box is the date when this graph was prepared and right side mentions days since induction of protocol. HLA match status of patient (PT) and donor (DN) are mentioned. On the X-axis is the follow-up in months since the patient was inducted in the protocol, on Y-axis left is antibody measurement by Luminexx assay (in mean fluorescent intensity – MFI) and on right side is serum creatinine (SCr; mg/dL) and peripheral T-regulatory cells (CD127low/−CD25highCD4+) in percentage. The different colored spikes are for antibodies shown by asterix in right side, black line is for SCr and yellow line for p-Tregs. On the graph are highlighted biopsy dates and findings. This figure shows that SCr and p-Tergs have remained fairly stable. On right corner is photomicrograph showing renal allograft biopsy performed at 3 years post-transplant showing normal glomerulus, part of a medium calibre artery and surrounding tubules and 1 artery, Hematoxylin and Eosin, 100×.