Figures & data
Figure 1. Search flow diagram for studies included in the meta analysis.
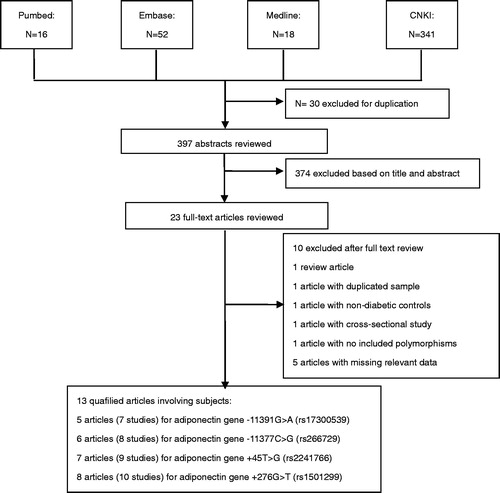
Table 1. Characteristics of studies included in the meta-analysis.
Figure 2. Forest plot for meta-analysis association between the ADIPOQ polymorphisms with DN risk (allele model). (a) −11391G > A, (b) −11377C > G, (c) +45T > G, (d) +276G > T.
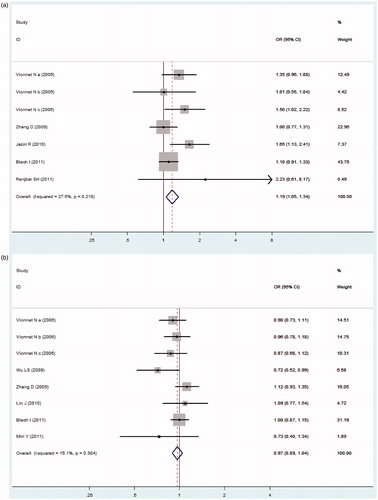
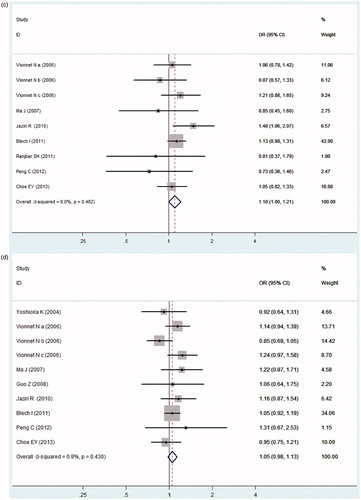
Table 2. MAF among controls stratified by ethnicity.
Table 3. Stratified analyses of the ADIPOQ polymorphisms on DN risk.
Figure 3. Sensitivity analyses. Horizontal line mean effect size (a) −11391G > A, (b) −11377C > G, (c) +45T > G, (d) +276G > T.
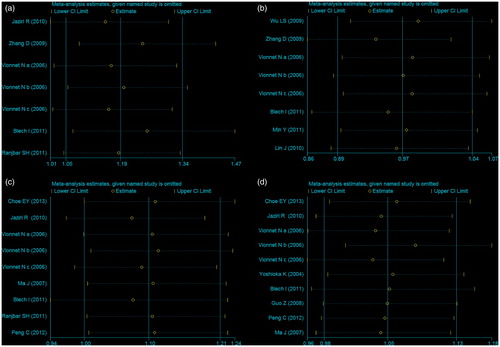
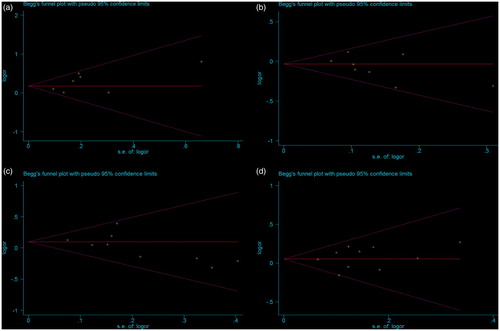
Figure 4. Funnel plot for assessing publication bias in this meta-analysis. (a) −11391G > A, (b) −11377C > G, (c) +45T > G, (d) +276G > T.