Figures & data
Figure 1. Effect of mesenteric lymph duct ligation on the ATP level in the renal tissue of hemorrhagic shock rats (mean ± SD, n = 6). *p < 0.05 versus the sham group; #p < 0.05 versus the shock at 90 min; △p < 0.05 versus the shock group after resuscitation 0 h; □p < 0.05 versus the shock group after resuscitate 1 h; ▴p < 0.05 versus the shock group at same time points.
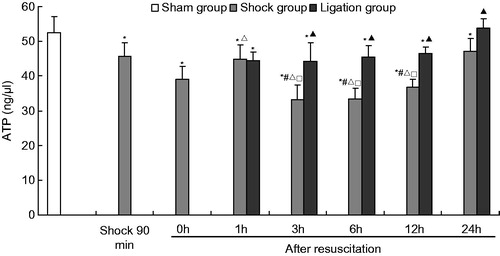
Figure 2. Effect of mesenteric lymph duct ligation on the Na+–K+–ATPase activity in the renal tissue of hemorrhagic shock rats (mean ± SD, n = 6). *p < 0.05 versus the sham group; #p < 0.05 versus the shock at 90 min; △p < 0.05 versus the shock group after resuscitation 0 h; ▴p < 0.05 versus the shock group at same time points.
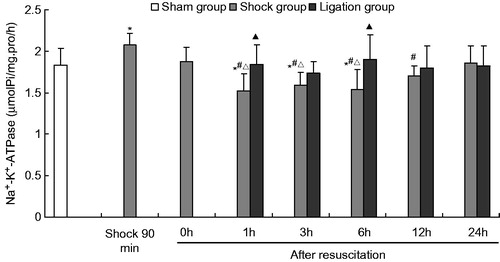
Figure 3. Effect of mesenteric lymph duct ligation on the Ca2+–ATPase activity in the renal tissue of hemorrhagic shock rats (mean ± SD, n = 6). *p < 0.05 versus the sham group; #p < 0.05 versus the shock 90 min; ▴p < 0.05 versus the shock group at same time points.
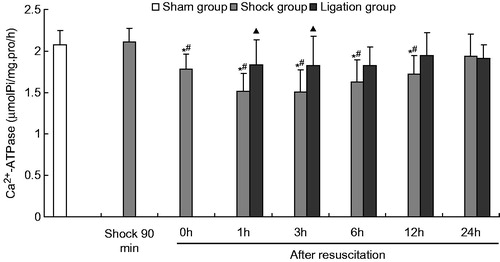
Figure 4. Effect of mesenteric lymph duct ligation on the Mg2+–ATPase activity in the renal tissue of hemorrhagic shock rats (mean ± SD, n = 6). *p < 0.05 versus the sham group; #p < 0.05 versus the shock at 90 min; △p < 0.05 versus the shock group after resuscitation 0 h; ▴p < 0.05 versus the shock group at same time points.
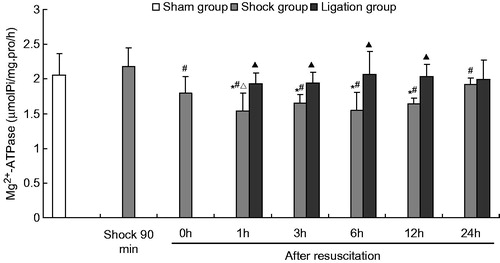
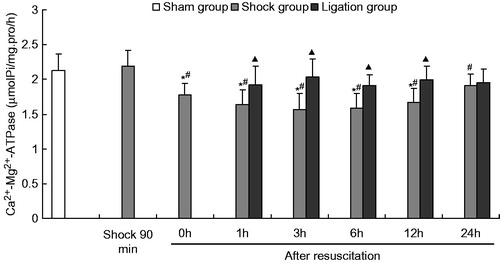
Figure 5. Effect of mesenteric lymph duct ligation on the Ca2+–Mg2+–ATPase activity in the renal tissue of hemorrhagic shock rats (mean ± SD, n = 6). *p < 0.05 versus the sham group; #p < 0.05 versus the shock at 90 min; ▴p < 0.05 versus the shock group at same time points.