Figures & data
Table 1. Plasma urea, creatinine, and blood pressure in the investigated groups.
Figure 1. The concentration of circulating blood nucleotides, ATP, ADP, AMP, and uric acid in investigated groups. For the evaluation of purine nucleotides concentration, fresh blood was immediately processed for their isolation after adding stabilizing solution of retard ATP degradation. ***p < 0.001 compared with the control; *p < 0.05 compared with the control; ooop < 0.001 compared with the essential hypertension group.
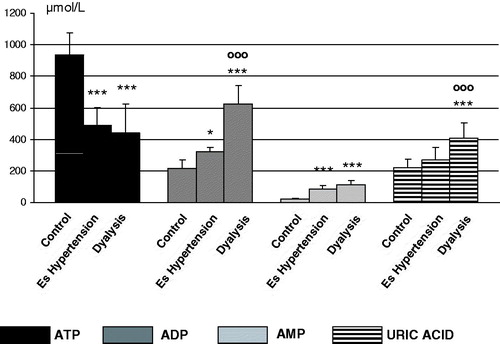
Figure 2. The index of ATP/ADP and ATP/uric acid in investigated groups. For the evaluation of purine nucleotides concentration, fresh blood was immediately processed for their isolation after adding stabilizing solution o retard ATP degradation. ***p < 0.001 compared with the control; ooop < 0.001 compared with the essential hypertension group.
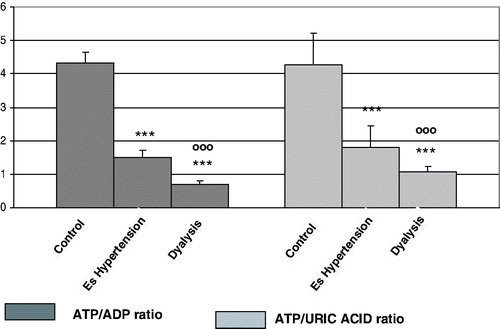
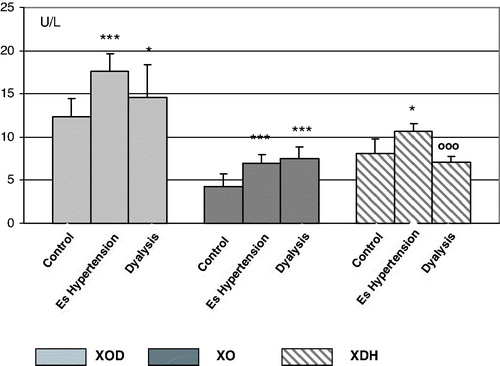
Figure 3. The activities of total Xanthine oxidoreductase (XOD), xanthine oxidase (XO), and xanthine dehydrogenase (XDH) in plasma of investigated groups. Xanthine oxidoreductase (XOD) and xanthine oxidase (XOD) were measured in plasma according to the liberation of uric acid,Citation34 in the presence of NADH (XOD) or absence of NADH (XO) when only molecular oxygen was electron acceptor. ***p < 0.001 compared with the control; *p < 0.05 compared with the control; ooop < 0.001 compared with the essential hypertension group.