Figures & data
Table 1. Patient characteristics.
Figure 1. Platelets apoptosis of 16 uremic patients. ΔΨm depolarization, as monitored by flow cytometry analysis with decreased fluorescence intensity in TMRE-stained platelets, was significantly obvious in uremic patients. HD, PD and ND groups had significant differences from controls. (A). Uremic platelets had enhanced FITC fluorescence intensity which represented PS exposure. HD, PD and ND groups had significant differences from controls. (B) For Western-Blot assay, a 17 kD fragment which exhibited caspase-3 activation was emerged in uremic platelets. (C) The expression changes of Bcl-2 protein family showed obviously decreased levels of Bcl-xL and Bcl-2, and enhanced level of Bax. (D) *p < 0.05, **p < 0.001.
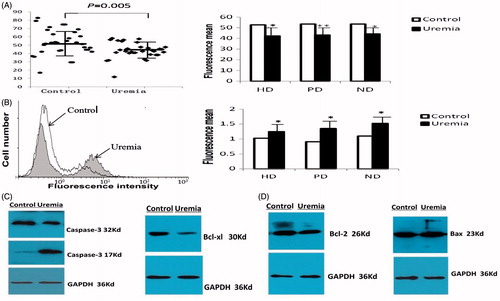
Table. 2. ΔΨm, PS exposure and P-selectin expression in three groups of uremic patients.
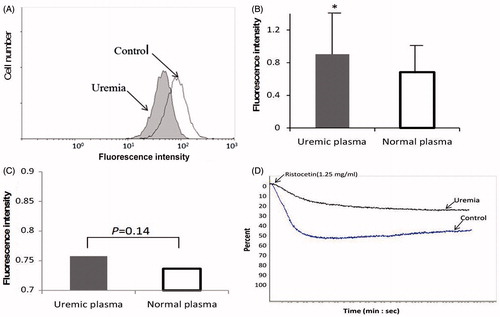
Figure 2. Normal platelets which incubated with uremic plasma showed obvious ΔΨm depolarization. (A) PS exposure. (B) Diminished aggregation function. (D) Meanwhile, there was no statistic significance between uremic plasma treated platelets and normal plasma treated platelets. (C) *p < 0.01.